Abstract
Intersections are one of the most crucial parts of urban transportation systems since they actively contribute to developing strategies to reduce traffic congestion. One of the major issues that nations around the world face is traffic congestion on roads and intersections. More than 90% of intersections on high-speed roads in developing countries have poor turning space, compared to 64% in developed countries. This study evaluates the performance of major intersections for improving traffic safety and efficiency in Shashemene Town. The objective of this study was to assess current traffic flow patterns, evaluate the effectiveness of existing traffic control measures, and propose potential improvements to enhance safety and efficiency at the selected major intersections. The scope of the study was limited to the three major intersections in Shashemene Town, such as Awasho Roundabout, Abosto Intersection, and Semaniya-Andi Intersection, with a focus on understanding the challenges faced in this urban context. The data were collected using a combination of traffic volume counts and user surveys during peak traffic hours. The SIDRA Intersection Version 8.0 software was employed to evaluate key performance indicators, including travel time, delay, travel speed, LOS, and V/C ratio. The analysis revealed significant congestion at the Awasho Roundabout, with an average travel speed of 35 Kph, a control delay of 24.1 s/veh, LOS C, and a V/C ratio of 0.81. The Abosto Intersection showed moderate delays with a delay of 34.1 s/veh, LOS D, and a V/C ratio of 0.98, while the Semaniya-Andi Intersection performed the best with a delay of 12.8 s/veh, LOS B, and a V/C ratio of 0.64. The findings indicate that while the Semaniya-Andi Intersection operates within acceptable performance levels, the Awasho Roundabout is severely congested, necessitating immediate interventions. To guide drivers, install clear and visible road markings, and ensure pedestrian safety. Installing well-marked pedestrian crossings improves traffic safety and efficiency of the roundabout as a short-term intervention. As a long-term improvement, redesigning the roundabout to accommodate higher traffic volumes and improve flow.
Keywords
Intersection Performance, Shashemene Town, SIDRA Intersection, Traffic Efficiency, Traffic Safety
1. Introduction
1.1. Background of the Study
The rapid growth of cities in developing countries is directly influenced by the extent of interaction they can achieve between cities and within individual cities. Urban transport enables and supports these interactions
| [1] | W. Abeje, "Sustainable urban mobility planning for coping challenges of urban transportation in the fast urbanizing Ethiopia" in the role of urban mobility in (re) shaping cities CODATU., 2012. https://trid.trb.org/View/1250407 |
[1]
. In contemporary times, cities in both developed and developing nations rely heavily on urban transport systems. Urban residents must engage in constant mobility to facilitate various urban activities and functions. This mobility is made possible through the use of transport mechanisms. In developing nations, urban transport infrastructures remain inadequate and have limited capacity to meet the increasing demands resulting from rapid urbanization
.
In developing countries, the rapid pace of urbanization has outstripped the capacity of transportation infrastructure, leading to significant traffic congestion and safety challenges. Ethiopia, as a rapidly urbanizing nation, is no exception to this trend. According to the World Bank Group in 2018, the urbanization rate in Africa is relatively standing at 37.1% and the estimated urban population of Ethiopia has grown from 11.8% in 1990 to 21.3% in 2020, with projections indicating that it will reach 37.6% by 2050
.
One of the major issues that nations around the world face is traffic congestion on roads and intersections. Traffic congestion at intersections is a result of poor road network design strategies, which frequently cause delays and increase travel times during regular and peak hours. Intersections are one of the most crucial parts of urban transportation systems since they actively contribute to developing strategies to reduce traffic congestion
. More than 90% of intersections on high-speed roads in developing countries have poor turning space compared to 64% in developed countries. Furthermore, 96% of roadsides on high-speed roads are dangerous in developing countries compared to 73% in developed countries
. As one of the fastest-growing economies in Africa, Ethiopia's towns are witnessing a surge in population, resulting in heightened pressure on transportation networks.
In Ethiopia, urban areas like Shashemene Town are experiencing rapid growth, leading to increased traffic congestion and safety concerns. Shashemene Town, located in the Oromia Region of Ethiopia, plays a key role as a transportation hub due to its strategic location along the main road connecting Addis Ababa to Hawassa. The existing road infrastructure often struggles to accommodate the rising number of vehicles, resulting in dangerous conditions at intersections. The town's growth has brought about significant increases in traffic volume, leading to challenges such as congestion, accidents, and delays, particularly at its major intersections. These issues not only affect the efficiency of the transportation system but also pose serious safety risks to road users
| [6] | A. M. Kelacha, "Assessment of Traffic Safety Problems and Awareness of Road Users, the Case of Shashemene Town," International Journal of Transportation Engineering and Technology, vol. 7, no. 2, p. 33, 2021. https://doi.org/10.11648/j.ijtet.20210702.11 |
[6]
.
Capacity, or the maximum rate of flow at which persons or vehicles can reasonably be expected to traverse an intersection, is much lower than their approach links. The critical aspect of increasing the capacity of any road lies in increasing the capacity of the intersection. Traffic signals, roundabouts, and stop and yield controls are commonly used in several grade junctions in urban areas to improve traffic safety and efficiency. Major intersections serve as critical nodes in the transportation network, where multiple traffic streams intersect and interact. The performance of intersections significantly impacts the overall flow of traffic, as well as the safety and convenience of road users
. Therefore, evaluating the performance of major intersections is essential for understanding the current state of the transportation system in Shashemene Town and identifying opportunities for improvement.
In recent years, various studies have emphasized the importance of intersection performance evaluation as a tool for improving urban traffic management. Advanced traffic analysis tools such as the SIDRA Intersection software have been widely used in many countries to model and optimize intersection performance by analyzing traffic flow, control measures, and safety features
. This study leverages such tools to provide a performance evaluation of the selected major intersections in Shashemene Town, contributing to the development of targeted interventions and strategies that enhance road safety and improve traffic flow.
1.2. Statement of the Problem
Road safety is an issue that does not receive anywhere near the attention it deserves, and it is one of our great opportunities to save lives around the world. Traffic congestion and safety issues at major intersections are global challenges faced by many towns around the world. According to the Global Status Report 2023 on Road Safety, the number of road traffic deaths is 1.35 million, and more than 50 million people are injured each year on the world’s roads. The risk of death in developing countries is 92%, which is three times higher than in developed countries
. Globally, traffic congestion, rising demand, and worries about road safety are posing problems for urban transportation networks. Ineffective crossings are a major cause of increased carbon emissions, significant economic losses, and higher accident rates worldwide. In the USA alone, intersections account for more than 50% of all urban road accidents. Similarly, the EU reported that 40% of urban road fatalities occur at or near intersections
| [10] | NHTSA, Traffic Safety Facts: Intersection Accidents in Urban Areas, U. Transportation, Ed., Washington, D. C.: National Highway Traffic Safety Administration, 2022. https://rosap.ntl.bts.gov/view/dot/79223 |
[10]
.
In developing countries, intersections continue to be critical bottlenecks in urban mobility systems, often exacerbating traffic congestion and contributing to road accidents. In Africa, road traffic fatalities are 26.6 deaths per 100,000 people, significantly higher than the global average of 17.4 per 100,000. The African region has the highest proportion of deaths, with a quarter of a million people dying on the region’s roads, approximately a fifth of the global total number of deaths. This means about 675 people die each day on the region’s roads
. According to the World Bank Road Safety Facility Reports 2022 in Ethiopia, the rate is even more alarming, with an estimated 37 deaths per 100,000 people, placing it among the highest in the region
.
In Ethiopia, the road safety situation is particularly concerning, with the country recording one of the highest rates of traffic fatality in the world. According to the UN Road Safety Performance Review official statistics for Ethiopia, 43 people were killed per 10,000 vehicles in the country in 2018. Viewed from another perspective, Ethiopia loses 13 people per day in road traffic crashes. Oromia Regional State's traffic problem is relatively higher than other Ethiopia regions. A total of 3,900 road traffic accidents happened in 2018, of which 1448 were serious injuries, 1386 were slight injuries, and 1,478 people died
.
Shashemene Town is an industrial and business base center in the southern part of Ethiopia, as well as the second-biggest Regio polis city after Adama town in the Oromia region. Its economic status attracts people and firms to the city, which leads to an increasing number of vehicles beyond the capacity of the intersections and hence high traffic congestion. The challenges faced by Shashemene Town are reflective of broader national and regional issues, where urbanization and economic growth have outpaced infrastructure development. The need for systematic intersection performance evaluations is critical to addressing traffic safety and efficiency issues in these growing urban centers.
Traffic safety and efficiency at intersections have become pressing concerns globally; more than 90% of intersections on high-speed roads in developing countries have poor turning space compared to 64% in developed countries
. Despite attempts by local authorities to implement various traffic control measures, these efforts have often been reactive and insufficient. There has been a lack of systematic intersection performance evaluation, which is crucial for identifying the underlying causes of inefficiencies and road safety hazards. Without robust data-driven analysis, it has been challenging to design effective interventions that address the town’s growing traffic demands
| [6] | A. M. Kelacha, "Assessment of Traffic Safety Problems and Awareness of Road Users, the Case of Shashemene Town," International Journal of Transportation Engineering and Technology, vol. 7, no. 2, p. 33, 2021. https://doi.org/10.11648/j.ijtet.20210702.11 |
[6]
.
This gap in the literature underscores the necessity for a focused investigation into the current traffic flow patterns, congestion levels, and effectiveness of existing traffic control measures at these intersections. Evaluation of the performance and capacity of major intersections is crucial for developing effective interventions and strategies that can enhance traffic safety and efficiency. This study seeks to address the challenges by conducting a comprehensive performance evaluation of the major intersections in Shashemene Town.
1.3. Objective of the Study
1.3.1. General Objective
The study's general objective is to evaluate the performance of major intersections for improving traffic safety and efficiency in Shashemene Town.
1.3.2. Specific Objectives
1) To assess the traffic flow patterns and congestion levels at major intersections in Shashemene Town.
2) To evaluate the effectiveness of existing traffic control measures in mitigating safety risks and enhancing traffic flow.
3) To propose strategies to enhance the safety and efficiency of major intersections based on the findings of the performance evaluation.
1.4. Scope of the Study
This study is defined by its geographical and thematic boundaries, focusing on the performance evaluation of major intersections in Shashemene Town. The research will specifically target selected intersections that have been identified as critical points for traffic safety and efficiency. It involves performance evaluation using key indicators such as travel time, control delay, travel average speed, LOS, and V/C ratio by using the SIDRA Intersection V.8.0. The data collection is based on traffic flow during peak hours (morning and evening) to assess intersection performance in terms of traffic safety and efficiency.
2. Materials and Research Methodology
2.1. Study Area
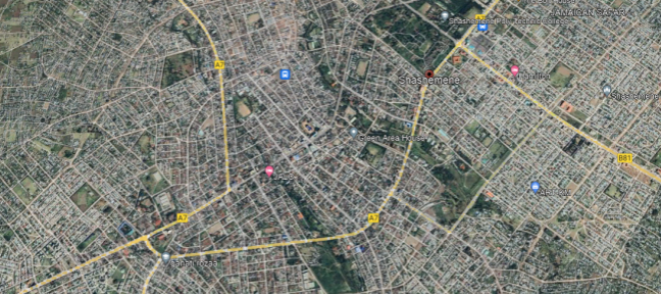
Shashemene Town is in the West Arsi Zone of the Oromia Regional State in Ethiopia. The town is approximately 240 km south of Addis Ababa, the capital city of Ethiopia. It is strategically positioned along the International Trans-African Highway 4 Cairo-Cape Town connecting Addis Ababa to Mombasa, making it a critical junction for local and regional traffic. It is about 1,939m above sea level, with coordinates of 7°12′N and 38°36′E. It has a total area of about 16,307 hectares and a population of 407,000. The town administration is divided into 4 sub-cities and 12 Woredas, and it is the most important business and commercial center for the southern part of Ethiopia
. The town is a bustling economic center, hosting a variety of markets, businesses, and industries. The town's transportation infrastructure includes a network of primary and secondary roads, with several major intersections that play a crucial role in managing traffic flow. The data obtained from the city municipal shows that the total length of road within the city is 385.8 km. Out of the total length of the roads, asphalt roads, gravel roads, cobblestone roads, red ash roads, and walkway roads have lengths of 66.25 km, 3.06 km, 110.81 km, 155.27 km, and 50.4 km respectively
.
Figure 1. Map of Shashemene Town Administration.
Source: Google Earth, Satellite Map: August 20, 2024
2.2. Selection of Major Intersections
According to the ERA Geometric Design Manual 2013, the selection of major intersection types for the study takes account of several criteria that considered traffic volumes, congestion levels, and physical layout factors
. There are many unsignalized intersections in Shashemene town; the criteria adopted for the selection of the intersection include a site survey, current traffic count data, and a Google traffic map aerial picture
. This study selected 2 four-legged intersections and 1 roundabout having a significant traffic volume, accident rate with different types of vehicle composition, and strategic importance in the corridors. The three selected major intersections are Awasho Roundabout, Abosto Intersection, and Semaniya-Andi Intersection. The selected intersection names were the locality names.
2.2.1. Awasho Roundabout
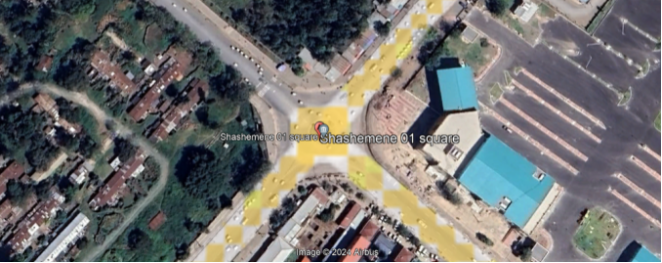
Awasho Roundabout is a two-lane, unsignalized roundabout located in the heart of Shashemene Town, specifically in Allache sub-city 01 kebele. This roundabout is a convergence point for four major roads that connect Shashemene to other towns in Ethiopia, such as Addis Ababa to the north, Hawassa to the south, Dodola to the east, and connect with Alelu sub-city to the west. The intersection is surrounded by the main bus station, military camp, school, college, and commercial areas, making it a high-traffic zone with a significant volume of pedestrians and vehicles. It has four approaches: Essa-Park Approach, Sodoma Approach, the Melka-Oda Approach, and the Alelu-Kella Approach
.
Figure 2. Shashemene Awasho Roundabout.
2.2.2. Abosto Intersection
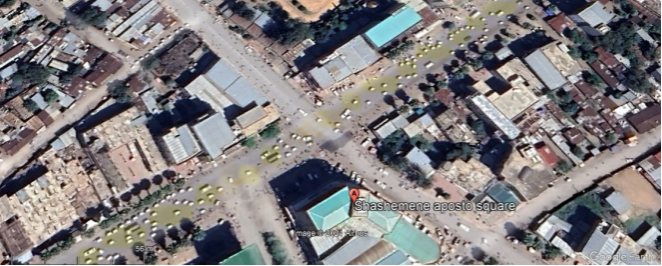
Abosto Intersection is an unsignalized intersection located in the Harufa sub-city. The intersection has two-lane approaches and a single lane on the Semaniya-Andi approach to the east. Traffic volume at this intersection is particularly high, especially during peak market hours, and serves as a major access critical point to connect the main market center of the town, which are the Abosto and Arada markets. It has four approaches the Mobil Approach, the Semaniya-Andi Approach, the Shewa-Ber Approach, and the Arada Approach
.
Figure 3. Shashemene Abosto Intersection.
2.2.3. Semaniya-Andi Intersection
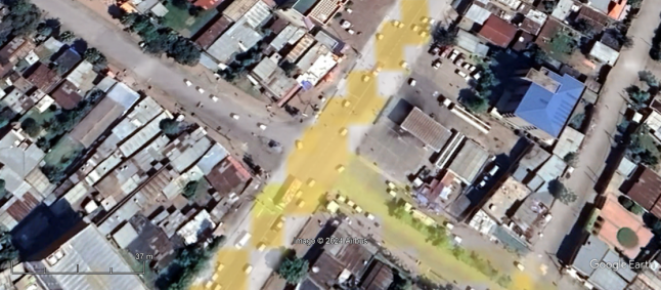
Semaniya-Andi Intersection is an unsignalized intersection located on the Addis Ababa to Hawassa main road in Allache sub-city 81 kebele. This intersection is surrounded by residential areas and schools, and connects two sub-cities (Allache and Harufa) and four kebeles (01, 02, 03, and 04) of the town. It has four approaches: the Gogeti Approach, the Police Station Approach, the Essa-park Approach, and the Abosto Approach
.
Figure 4. Shashemene Semaniya-Andi Intersection.
2.3. Study Design
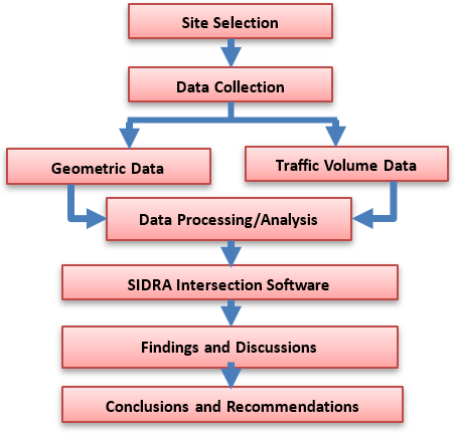
Figure 5. Study flow chart.
This study will employ a mixed-methods approach, combining quantitative and qualitative research approaches. The quantitative aspect involves collecting and analyzing numerical data. This includes traffic volume counts, geometric data, and SIDRA Intersection software analysis. The research design's qualitative component focuses on understanding stakeholders' perceptions, experiences, and opinions regarding traffic issues in Shashemene Town.
2.4. Data Source and Collection
The study approach involves primary and secondary data collection methods using various apparatuses and tools. The primary sources of data collection refer to the direct gathering of data from the selected intersections. A field measure has been done to gather data on traffic volume counts. The secondary sources of data collection refer to the available data that has been collected by traffic agencies, governments, researchers, documenting as a file, and other relevant factors. This study used manuals such as HCM 2010, ERA Geometric Design Manual 2013, and SIDRA software parameters.
2.4.1. Apparatuses and Tools of Data Collection
The following apparatuses and tools were utilized for data collection:
1) Mobile Cameras: used to record video to capture traffic flow characteristics such as vehicle volume and classification at the intersections.
2) Manual Counting Sheets: are employed during peak hours to cross-verify data collected by traffic counters.
3) Measuring Tape: used to collect geometric data, such as lane widths, intersection dimensions, and turning radius.
4) Google Earth: used to provide a detailed satellite view of the intersection and surrounding areas.
2.4.2. Traffic Volume Counts
Traffic volume counts are conducted to determine the number, movements, and Classification of roadway vehicles at the selected major intersections.
1) Count Duration
Data is collected during the morning (6:00 AM - 9:00 AM) and evening (4:00 PM - 7:00 PM) peak hours, when traffic volumes are typically highest. Volume was counted in 15-minute intervals by considering different type of vehicles and turning movement mechanisms: left (L), through (Th), and right (R) turnings.
2) Vehicle Classification
The vehicle classification helps to understand the composition of traffic and its impact on congestion. According to the vehicle classification of ERA Manual 2013 and HCM 2010, this study classified the vehicles, including Bajaj’s (Ba), cars (Ca), pickup cars (PC), buses (Bu), light trucks (LT), heavy trucks, motorcycles (Mo), bicycles (Bi), and pedestrians (Ped).
Table 1. Passenger Car Unit factors of different vehicles.
Passenger Car Equivalents of Different Vehicles (source: HCM 2010) |
Vehicle types | Ba | Ca | PC | Bu | LT | HT | Mo | Bi | Ped |
PCU | 0.8 | 1.0 | 1.2 | 3.0 | 4.0 | 5.0 | 0.5 | 0.2 | 0.15 |
2.4.3. Geometric Data
As per the requirement of SIDRA Intersection software, the collected geometric data, including approach names, lane width and length, lane configurations, and class of road, are measured with a tape meter and gathered from the Shashemene City Road Construction Office.
2.5. Data Analysis Techniques and Tools
The data analysis techniques used in this study employ a combination of descriptive statistics and comparative analysis methods. Utilize SIDRA Intersection 8.0 to analyze the existing traffic performance of the selected major intersections; inspect several traffic alternatives and select the best option. The collected traffic volume data was analyzed to determine the average and peak traffic volumes for different types of vehicles and directional-wise. Determining vehicle composition in the percentage of different vehicle types in the traffic stream. Assessing congestion levels by examining metrics such as TTT, control delay, queue lengths, and the LOS for each intersection was assessed using established criteria from the HCM 2010 and the SIDRA Intersection software. The V/C ratio is calculated to determine the degree of saturation at each intersection approach
.
2.6. SIDRA Intersection Software
SIDRA Intersection 8.0 was utilized as a primary tool for analyzing the performance of the selected major intersections.
2.6.1. Site Input Data
The input data for the SIDRA Intersection includes various parameters that define the traffic and geometric characteristics of the intersections. The key components of the input data are such as Intersection dialogue includes site name, site ID, site category, site, and approach geometry; Movement definitions involve specifying the standard class (light vehicles, heavy vehicles) and traffic movements at the intersection, including through movements, left turns, and right turns. The lane geometry dialogue includes lane configuration, lane discipline, and lane data; The Roundabouts Dialogue includes the number of circulating lanes, circulating width, island diameter, entry radius, and entry angle; Pedestrian Dialogue captures data on pedestrian movements and crossings at the intersection; Volumes Dialogue involves inputting traffic volume data, typically measured in PCU/hr; and Site demand and sensitivity dialogue are used for scenario analysis including none, flow scale, design life, and sensitivity analysis to align with the specific objectives of the study
| [8] | A. Transport, "Traffic Modelling Guidelines – SIDRA INTERSECTION," in MODEL CONSTRUCTION, Adelaide, SA., Network Management Services Directorate, 2023, pp. 23-76. https://www.sidrasolutions.com/media/99/download |
| [15] | Akçelik, R, "SIDRA for the highway capacity manual," 1990. Available: https://www.sidrasolutions.com/software/sidra-intersection/features/introduction/highway-capacity-manual-hcm-sidra-intersection |
[8, 15]
.
2.6.2. Site Output Data
SIDRA Intersection 8.0: The output data are such as Detailed output includes detailed information on sign control, movements, lanes, and flow rates; the intersection summary includes key metrics such as travel speed, travel time, total demand flows, degree of saturation, effective intersection capacity, control delay, and the LOS; Movement summary output details the performance of individual traffic movements at the intersection, such as left turns, right turns, and through movements; The lane summary includes lane demand capacity volumes, lane utilization ratio, lane configuration, capacity adjustment, lane probability blockage, and saturation flow rates; and Lane flow output includes the number of vehicles entering and exiting each lane during the analysis period, the capacity of vehicles per hour, and the v/c ratio
| [8] | A. Transport, "Traffic Modelling Guidelines – SIDRA INTERSECTION," in MODEL CONSTRUCTION, Adelaide, SA., Network Management Services Directorate, 2023, pp. 23-76. https://www.sidrasolutions.com/media/99/download |
| [15] | Akçelik, R, "SIDRA for the highway capacity manual," 1990. Available: https://www.sidrasolutions.com/software/sidra-intersection/features/introduction/highway-capacity-manual-hcm-sidra-intersection |
[8, 15]
.
3. Results and Discussions
3.1. Assessment of the Current Traffic Flow Patterns
This assessment includes a detailed examination of traffic volume, direction-wise traffic distribution, and vehicle composition using the data collected from field observations.
3.1.1. Traffic Volume Analysis
The traffic volume analysis examines the total number of vehicles passing through the intersections during different periods. It is typically measured in PCU to standardize the effect of different vehicle types.
1) Intersection-1: Awasho Roundabout
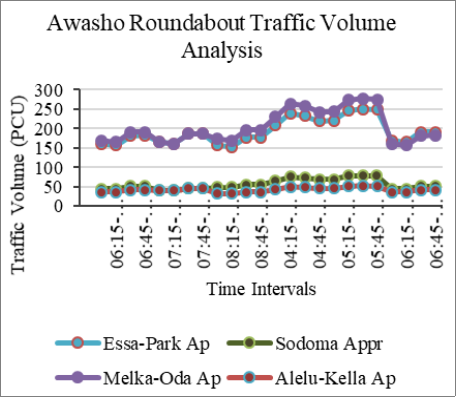
Awasho roundabout experiences the highest traffic volumes, particularly during morning and evening peak hours. Melka-Oda's approach shows the highest traffic volumes, consistently ranging between 160 and 280 PCUs. The Essa-Park approach also exhibits high traffic volumes with between 150 and 250 PCUs. This approach shows a steady increase in traffic volume from morning PH at 08:15 to 09:00 and evening PH at 04:15 to 06:15 high traffic volume, followed by a slight decrease towards the end of the observed period. The Sodoma approach experiences moderate traffic volumes, generally between 50 and 80 PCUs. Alelu-Kella's approach has the lowest traffic volumes, ranging from 10 to 50 PCUs.
Figure 6. Awasho roundabout traffic volume analysis.
2) Intersection-2: Abosto Intersection
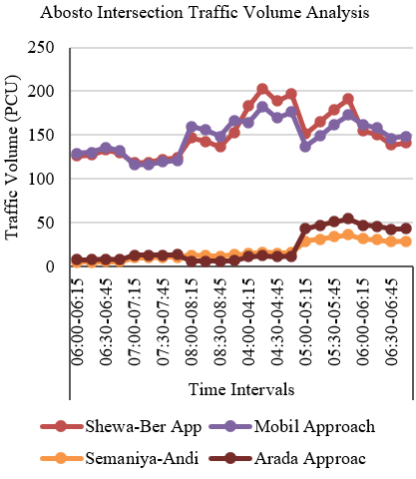
Figure 7. Abosto Intersection Traffic Volume Analysis.
The Abosto intersection also shows significant traffic volumes, primarily driven by local commercial activities and access to market areas. The Shewa-Ber approach exhibits high traffic volumes, ranging from 110 to 200 PCUs. The traffic volume peaks between 04:15 and 04:30, indicating a high influx of vehicles during this period. The Mobil approach shows high traffic volumes, fluctuating between 110 and 180 PCUs. The traffic volume peaks around 06:30-06:45, with a gradual decrease towards the end of the observed period. The Semaniya-Andi approach experiences have the lowest traffic volumes, generally between 10 and 40 PCUs.
3) Intersection-3: Semaniya-Andi Intersection
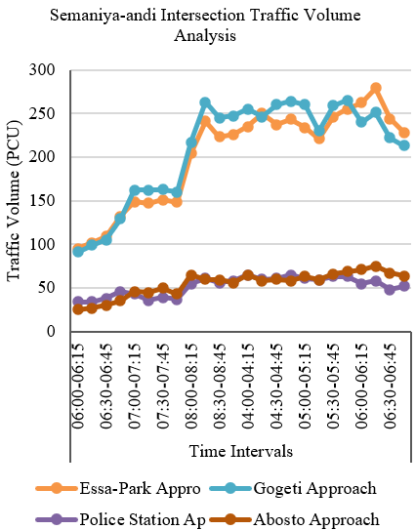
The Semaniya-Andi intersection is experiencing fluctuating volumes, with peaks occurring during market days and working hours, contributing to congestion. The Essa-Park approach consistently shows high traffic volumes, peaking between 150 and 300 PCUs. The police station approach has relatively lower traffic volumes, typically below 100 PCU, indicating less congestion. The Abosto approach also shows low traffic volumes, generally below 100 PCU, suggesting it is the least busy among the four approaches.
Figure 8. Semaniya-andi Intersection Traffic Volume Analysis.
3.1.2. Traffic Direction-Wise Analysis
The traffic direction-wise analysis focuses on the distribution of traffic volumes during the morning and evening peak hours among the different turning movements at the intersections, such as left turns, right turns, and through movements. The traffic volume is expressed in PCU per hour (PCU/h), categorized by direction of travel and pedestrian traffic.
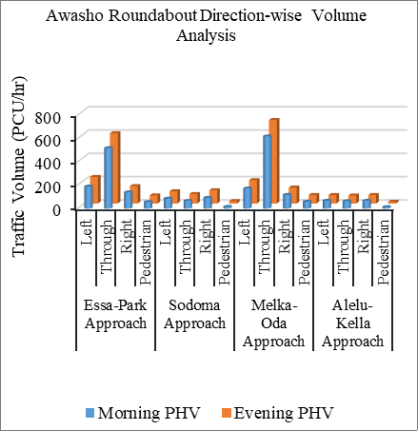
1) Intersection-1: Awasho Roundabout
The traffic direction-wise analysis for the Awasho Roundabout provides insights into the distribution and flow of vehicles from different approaches. The vehicle counts indicate morning PHV 519 and 620 PCU/h for the Essa-Park and Melka-Oda approaches, respectively. The evening PHV shows total counts of 603 and 716 PCU/h, indicating a consistent pattern of high traffic volume. The presence of pedestrians (13 to 60 PCU/h in the morning and 15 to 73 PCU/h in the evening).
Figure 9. Awasho roundabout direction-wise volume analysis.
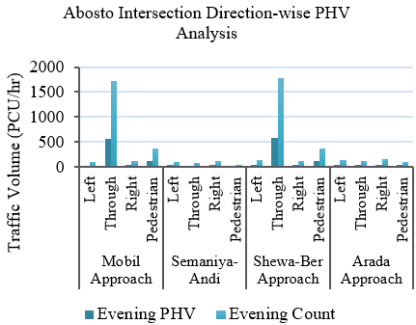
2) Intersection-2: Abosto Intersection
The vehicle counts for the Abosto Intersection indicate significant traffic demand, particularly in the morning; PHV totals 544 and 527 PCU/h for the Mobil and Shewa-Ber approaches, respectively, suggesting high usage of these routes. The evening peak shows a similar trend, with total counts of 643 and 681 PCU/h, indicating a consistent pattern of high traffic volume. The Mobil approach shows a notable number of through movements (484 in the morning and 572 in the evening), which may contribute to congestion. The presence of pedestrians is 104 to 126 PCU/h in the morning and 36 to 52 PCU/h in the evening peak hours in terms of PCU.
Figure 10. Abosto intersection direction-wise PHV analysis.
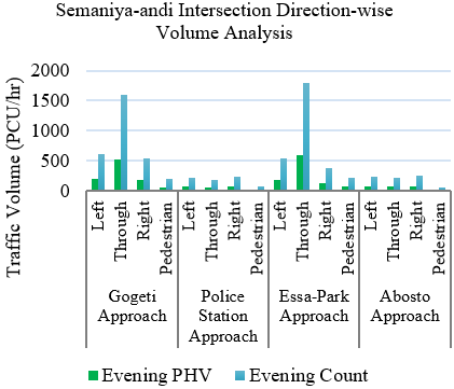
3) Intersection-3: Semaniya-Andi Intersection
The data presented reflects the traffic flow characteristics at the Semaniya-Andi Intersection during peak hours. The morning PHV totals 681 and 642 PCUs for the Gogeti and Essa-Park approaches respectively. The evening peak shows a similar trend, with total counts of 988 and 978 PCUs, indicating a consistent pattern of high traffic volume. The Gogeti approach shows a notable number of through movements of 372 PCU in the morning and 531 PCU in the evening. The pedestrian counts volume in terms of PCU although 41 to 68 in the morning and 22 to 23 in the evening PHV.
Figure 11. Semaniya-andi Intersection Direction-wise Volume Analysis.
3.1.3. Traffic Vehicle Composition Analysis
The traffic vehicle composition analysis examines the vehicle classification, which includes Bajaj, cars, pickup cars, buses, light trucks, heavy trucks, motorcycles, bicycles, and pedestrians. The data is summarized in pie charts representing the percentage composition of each vehicle type in terms of PCU/hr.
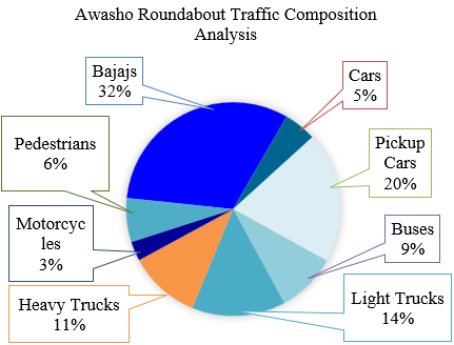
1) Intersection-1: Awasho Roundabout
Figure 12. Awasho Roundabout Traffic Composition Analysis.
At the Awasho Roundabout, the traffic vehicle composition reveals a diverse mix of vehicle types, with the highest proportion represented by Bajaj, accounting for 32% of the total traffic flow. Following Bajaj, pickup cars constitute 20%, demonstrating their significant presence on the road. Light trucks represent 14%, heavy trucks 11%, buses 9%, cars 5%, and pedestrians make up 6% of the total traffic.
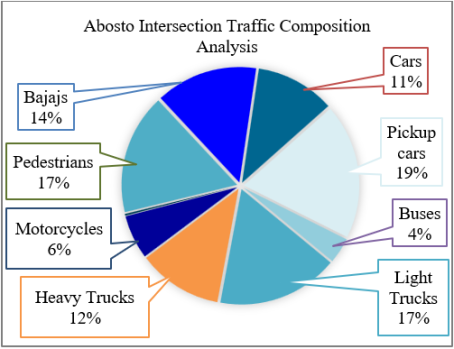
2) Intersection-2: Abosto Intersection
At Abosto Intersection vehicle composition reveals that pickup cars constitute the highest percentage at 19%, followed closely by light trucks at 17% and pedestrians also at 17%. Bajaj accounts for 14% of the traffic, while heavy trucks represent 12%. Cars make up 11% of the total, and buses have the smallest share at 4%.
Figure 13. Abosto Intersection Traffic Composition Analysis.
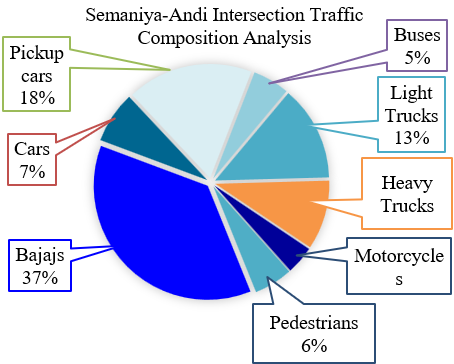
3) Intersection-3: Semaniya-Andi Intersection
The vehicle composition analysis at the Semaniya-Andi Intersection reveals that Bajaj constitutes the largest share of traffic at 37%. Following Bajaj, pickup cars account for 18%, reflecting their utility for both personal and commercial use. Cars, while present, account for only 7%, and pedestrians account for 5% of the total.
Figure 14. Semaniya-Andi Intersection Traffic Composition Analysis.
3.2. Intersection Congestion Levels Analysis
This section analyzes the congestion levels at the selected intersections in Shashemene Town, focusing on key metrics such as total travel time, average control delay, and travel average speed.
3.2.1. Total Travel Time (TTT)
The TTT is the sum of time taken by all vehicles to traverse an intersection. It was calculated for each intersection based on the observed traffic volumes and delays during peak hours. The SIDRA Intersection is expressing TTT in vehicle-hours per hour (veh-h/h). At the Awasho Roundabout, the Melka-Oda approach experiences the highest TTT at 61.7 veh-h/h, while the Sodoma and Alelu-Kella approaches have lower values of 12.7 and 6.5, respectively, and the total intersection TTT of the roundabout is 125 veh-h/h, indicating considerable congestion. In contrast, the Abosto Intersection exhibits a total TTT of 66.7 veh-h/h, with the Shewa-Ber approach accounting for the highest TTT at 29.6, followed by the Mobil approach at 28.6, and the other approaches showing much lower values. Lastly, at the Semaniya-Andi Intersection, the Gogeti approach has the highest TTT of 25.5, and Police station has the lowest TTT of 4.1, contributing to a total intersection TTT of 57.8 veh-h/h. The TTT of each intersection is detailed in
Table 2.
3.2.2. Average Control Delay
The analysis of the average control delay at the Abosto Intersection shows a more uniform and higher delay across its approaches, and the intersection delay is 34.1 seconds. In contrast, in the Awasho Roundabout, the highest delay is observed at the Melka-Oda approach, and the overall control delay of the roundabout is 24.1 seconds. Lastly, at the Semaniya-Andi Intersection, delay is 12.8 seconds. The control delay of each intersection is detailed in
Table 2.
3.2.3. Travel Average Speed
The travel average speed was calculated to assess the overall efficiency of traffic flow at each intersection. The Awasho Roundabout records a moderate average travel speed of 35 km/h, the Melka-Oda approach experiences the slowest travel speed at just 33.7km/h, and the Sodoma approach performs better with an average speed of 35.3 km/h. In contrast, at the Abosto Intersection, travel speeds are generally lower, with the Arada approach achieving the highest speed at 32.9 km/h and an overall intersection average of 30 km/h. Lastly, at the Semaniya-Andi Intersection, travel speeds are the highest among the assessed locations, with the Abosto approach leading at 37.0 km/h, followed by the Police Station at 36.4 km/h and Essa-Park at 35.9 km/h, resulting in an overall intersection average speed of 35km/h. The travel speed of each intersection is detailed in
Table 2.
Table 2. Intersection congestion levels analysis of selected intersections.
Site Name | Approach | TTT (veh-h/h) | Delay Control (sec/veh) | Travel Speed (km/h) |
Name | Direction | Approaches | Intersection | Approaches | Intersection | Approaches | Intersection |
Awasho Roundabout | Essa-Park | South | 44.1 | 125.0 | 21.5 | 24.1 | 35.2 | 35 |
Sodoma | East | 12.7 | 16.6 | 36.2 |
Melka-Oda | North | 61.7 | 30.0 | 33.7 |
Alelu-Kella | West | 6.5 | 17.8 | 35.3 |
Abosto Intersection | Mobil | South | 28.6 | 66.7 | 31.2 | 34.1 | 30.9 | 30 |
Semaniya-Andi | East | 3.9 | 31.9 | 31.9 |
Shewa-Ber | North | 29.6 | 38.1 | 29.2 |
Arada | West | 4.6 | 28.2 | 32.9 |
Semaniya-Andi Intersection | Gogeti | South | 25.5 | 57.8 | 16.0 | 12.8 | 34.5 | 35 |
Police Station | East | 4.1 | 9.4 | 36.4 |
Essa-Park | North | 23.2 | 10.9 | 35.9 |
Abosto | West | 4.8 | 9.7 | 37.0 |
3.3. Capacity Performance of the Intersections
The capacity performance of the major intersections is analyzed to determine their ability to accommodate the existing and future traffic demands. This section presents the LOS analysis and the V/C ratio analysis.
3.3.1. LOS Analysis
The LOS analysis highlights significant congestion at the Awasho Roundabout, particularly at the Melka-Oda approaches operating at LOS D. The Alelu-Kella and Sodoma approaches perform slightly better at LOS C. The Abosto Intersection is indicating LOS E. In contrast, the Semaniya-Andi Intersection shows better performance operating at LOS B, indicating generally stable and efficient traffic flow conditions.
Table 3. LOS analysis of the selected major Intersection.
Site Name | Approaches Lane | LOS |
Name | Length | Lane | Intersection |
Awasho Roundabout | Essa-Park | 900m | C | C |
Sodoma | 900m | C |
Melka-Oda | 850m | D |
Alelu-Kella | 600m | C |
Abosto Intersection | Mobil | 750m | D | D |
Semaniya-Andi | 750m | D |
Shewa-Ber | 400m | E |
Arada | 800m | D |
Semaniya-Andi Intersection | Gogeti | 600m | C | B |
Police Station | 400m | A |
Essa-Park | 450m | B |
Abosto | 750m | A |
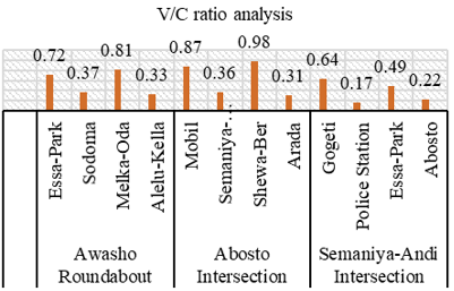
3.3.2. Volume to Capacity (V/C) Ratio Analysis
Figure 15. V/C ratio analysis.
The V/C ratio analysis indicates that the Awasho Roundabout has significant congestion issues, especially at the Melka-Oda approach, with V/C ratios of 0.81, while the Alelu-Kella approach operates well below capacity at 0.33. The Abosto Intersection shows near-capacity conditions at the Mobil and Shewa-Ber approaches, with V/C ratios of 0.98, while the Semaniya-Andi and Arada approaches operate well below capacity. The Semaniya-Andi Intersection performs well overall at 0.64, with all approaches operating below capacity, indicating smooth traffic flow.
4. Conclusion and Recommendations
4.1. Conclusion
This study set out to evaluate the performance of major intersections in Shashemene Town to enhance traffic safety and efficiency. The research focused on three key intersections: Awasho Roundabout, Abosto Intersection, and Semaniya-Andi Intersection. The criteria adopted for selecting these three intersections include a site survey, current traffic data collected, and a Google traffic map aerial picture. The data was collected through video recording and manual traffic volume counts during the morning (6:00 AM - 9:00 AM) and evening (4:00 PM - 7:00 PM) peak hours, when traffic volumes are typically highest. Volume was counted in 15-minute intervals by considering different type of vehicles and turning movement mechanisms. According to HCM standards, the traffic data collected for different categories of vehicles was converted to PCU. Through data collection and analysis using SIDRA Intersection 8.0, was employed to evaluate key performance indicators, including travel time, delay, LOS, and a V/C ratio. The analysis revealed significant congestion at the Awasho Roundabout, with a travel time of 125 minutes, a control delay of 24.1 s/veh, LOS C, and a V/C ratio of 0.81. The Abosto Intersection showed moderate delays with a delay of 34.1 s/veh, LOS D, and a V/C ratio of 0.98, while the Semaniya-Andi Intersection performed the best with a delay of 12.8 s/veh, LOS B, and a V/C ratio of 0.64. The findings indicate that while the Semaniya-Andi Intersection operates within acceptable performance levels, the Awasho Roundabout is severely congested, necessitating immediate interventions. The study concludes by identifying areas where traffic safety and efficiency can be enhanced and discussing how the findings align with the research objectives and contribute to the broader understanding of intersection management in an urban context.
4.2. Recommendations
Based on the findings of this research, the following recommendations are proposed to improve traffic safety and efficiency at the selected intersections:
1) Install clear signage, traffic signals, and road markings at Awasho Roundabout, Abosto Intersection, and Semaniya-Andi Intersection.
2) Upgrade intersection infrastructure by widening lanes, adding pedestrian crossings, and improving lighting to enhance safety and traffic flow.
3) Relocate markets near intersections, particularly at the Abosto Intersection, to minimize pedestrian-vehicular conflicts.
4) Designate parking areas and pick-up/drop-off zones for Bajaj vehicles near intersections to reduce roadside congestion.
5) Strengthen traffic law enforcement through better coordination with the traffic police to ensure compliance by all road users.
6) Launch awareness campaigns to educate drivers and pedestrians on traffic rules and safe road practices.
7) Establish a system for continuous traffic data collection and monitoring to evaluate implemented measures and make data-driven improvements.
Abbreviations
ERA | Ethiopian Roads Authority |
HCM | Highway Capacity Manual |
LOS | Level of Services |
PCU | Passenger Car Units |
PHV | Peak Hour Volume |
SIDRA | Signalized & Un-signalized Intersection Design and Research Aid |
TTT | Total Travel Time |
WHO | World Health Organization |
Author Contributions
Muktar Jemal Wabe is the sole author. The author read and approved the final manuscript.
Acknowledgements
The author wishes to express sincere gratitude to Mattu University for supporting throughout this research. Special thanks to my advisors, Dr. Tarekegn Kumala and Ing. Fikadu Rage, for their invaluable guidance, encouragement, and expertise, which greatly contributed to the successful completion.
Funding
The author received no financial support for the research conducted in this thesis.
Conflicts of Interest
The author declares no conflict of interest.
References
| [1] |
W. Abeje, "Sustainable urban mobility planning for coping challenges of urban transportation in the fast urbanizing Ethiopia" in the role of urban mobility in (re) shaping cities CODATU., 2012.
https://trid.trb.org/View/1250407
|
| [2] |
M. Solanke, "Challenges of urban transportation in Nigeria.," International Journal of Development and Sustainability, vol. 2, no. 2, pp. 891-901, 2013.
https://www.isdsnet.com/ijds-v2n2-33.pdf
|
| [3] |
J. a. S. J. Saghir, "Urbanization in Sub-Saharan Africa: Meeting Challenges by Bridging Stakeholders," Center for Strategic & International Studies (CSIS), pp. 1-7, 2018.
https://www.jstor.org/stable/pdf/resrep22454.pdf
|
| [4] |
R. H. &. H. I. T. Al-Rubaee, "Performance analysis, evaluation, and improvement of selected unsignalized intersections using SIDRA software" Open Engineering, vol. 14, no. 1, 2024.
https://www.degruyterbrill.com/document/doi/10.1515/eng-2022-0537/html
|
| [5] |
MLT-Ethiopia, "National Road Safety Strategy -Second Decade of Action Plan," 2022. Available:
https://irfofficial.org/wp-content/uploads/2022/12/Ethiopian-Road-Safety-Performance-Report_FDRE.pdf
|
| [6] |
A. M. Kelacha, "Assessment of Traffic Safety Problems and Awareness of Road Users, the Case of Shashemene Town," International Journal of Transportation Engineering and Technology, vol. 7, no. 2, p. 33, 2021.
https://doi.org/10.11648/j.ijtet.20210702.11
|
| [7] |
W. Taddesse, "Assessing & Quantifying the Level of Traffic Congestion at Major Intersections in Addis Ababa," 2011.
https://etd.aau.edu.et/items/42229f95-7fe7-4a9b-af80-94e02d0540cc
|
| [8] |
A. Transport, "Traffic Modelling Guidelines – SIDRA INTERSECTION," in MODEL CONSTRUCTION, Adelaide, SA., Network Management Services Directorate, 2023, pp. 23-76.
https://www.sidrasolutions.com/media/99/download
|
| [9] |
Bloomberg, M. R. "Global status report on road safety 2023." World Health Organization. 2023.
https://www.who.int/news-room/fact-sheets/detail/road-traffic-injuries
|
| [10] |
NHTSA, Traffic Safety Facts: Intersection Accidents in Urban Areas, U. Transportation, Ed., Washington, D. C.: National Highway Traffic Safety Administration, 2022.
https://rosap.ntl.bts.gov/view/dot/79223
|
| [11] |
World Bank, "World Population Death Rates," 2022. Available:
https://documents1.worldbank.org/curated/en/099015103232236266/pdf/P15331704d332f0430b90a081f4c34d90fa.pdf
|
| [12] |
UN, "Road Safety Performance Review on Ethiopia," 2020. Available:
https://unece.org/sites/default/files/2021-01/RSPR_Ethiopia_Report_Final_web_1.pdf
|
| [13] |
S. C. O. of Municipality, "Road and Transportation Office," 20 August 2024. Available:
https://www.shashemene.gov.et/en/office/shashemene-city-transport-office
|
| [14] |
ERA, Geometric Design Manual 2013, Addis Ababa, Ethiopia: Ethiopian Roads Administration, 2013, pp. 3-5.
https://pdfcoffee.com/1-geometric-design-manual-2013-pdf-free.html
|
| [15] |
Akçelik, R, "SIDRA for the highway capacity manual," 1990. Available:
https://www.sidrasolutions.com/software/sidra-intersection/features/introduction/highway-capacity-manual-hcm-sidra-intersection
|
Cite This Article
-
APA Style
Wabe, M. J. (2025). Performance Evaluation of Major Intersection for Improvement of Traffic Safety and Efficiency in Shashemene Town. American Journal of Construction and Building Materials, 9(2), 40-52. https://doi.org/10.11648/j.ajcbm.20250902.12
 Copy
|
Copy
|
 Download
ACS Style
Wabe, M. J. Performance Evaluation of Major Intersection for Improvement of Traffic Safety and Efficiency in Shashemene Town. Am. J. Constr. Build. Mater. 2025, 9(2), 40-52. doi: 10.11648/j.ajcbm.20250902.12
Copy
|
Download
AMA Style
Wabe MJ. Performance Evaluation of Major Intersection for Improvement of Traffic Safety and Efficiency in Shashemene Town. Am J Constr Build Mater. 2025;9(2):40-52. doi: 10.11648/j.ajcbm.20250902.12
Copy
|
Download
-
@article{10.11648/j.ajcbm.20250902.12,
  author = {Muktar Jemal Wabe},
  title = {Performance Evaluation of Major Intersection for Improvement of Traffic Safety and Efficiency in Shashemene Town},
  journal = {American Journal of Construction and Building Materials},
  volume = {9},
  number = {2},
  pages = {40-52},
  doi = {10.11648/j.ajcbm.20250902.12},
  url = {https://doi.org/10.11648/j.ajcbm.20250902.12},
  eprint = {https://article.sciencepublishinggroup.com/pdf/10.11648.j.ajcbm.20250902.12},
  abstract = {Intersections are one of the most crucial parts of urban transportation systems since they actively contribute to developing strategies to reduce traffic congestion. One of the major issues that nations around the world face is traffic congestion on roads and intersections. More than 90% of intersections on high-speed roads in developing countries have poor turning space, compared to 64% in developed countries. This study evaluates the performance of major intersections for improving traffic safety and efficiency in Shashemene Town. The objective of this study was to assess current traffic flow patterns, evaluate the effectiveness of existing traffic control measures, and propose potential improvements to enhance safety and efficiency at the selected major intersections. The scope of the study was limited to the three major intersections in Shashemene Town, such as Awasho Roundabout, Abosto Intersection, and Semaniya-Andi Intersection, with a focus on understanding the challenges faced in this urban context. The data were collected using a combination of traffic volume counts and user surveys during peak traffic hours. The SIDRA Intersection Version 8.0 software was employed to evaluate key performance indicators, including travel time, delay, travel speed, LOS, and V/C ratio. The analysis revealed significant congestion at the Awasho Roundabout, with an average travel speed of 35 Kph, a control delay of 24.1 s/veh, LOS C, and a V/C ratio of 0.81. The Abosto Intersection showed moderate delays with a delay of 34.1 s/veh, LOS D, and a V/C ratio of 0.98, while the Semaniya-Andi Intersection performed the best with a delay of 12.8 s/veh, LOS B, and a V/C ratio of 0.64. The findings indicate that while the Semaniya-Andi Intersection operates within acceptable performance levels, the Awasho Roundabout is severely congested, necessitating immediate interventions. To guide drivers, install clear and visible road markings, and ensure pedestrian safety. Installing well-marked pedestrian crossings improves traffic safety and efficiency of the roundabout as a short-term intervention. As a long-term improvement, redesigning the roundabout to accommodate higher traffic volumes and improve flow.},
 year = {2025}
}
Copy
|
Download
-
TY  - JOUR
T1  - Performance Evaluation of Major Intersection for Improvement of Traffic Safety and Efficiency in Shashemene Town
AU  - Muktar Jemal Wabe
Y1  - 2025/10/09
PY  - 2025
N1  - https://doi.org/10.11648/j.ajcbm.20250902.12
DO  - 10.11648/j.ajcbm.20250902.12
T2  - American Journal of Construction and Building Materials
JF  - American Journal of Construction and Building Materials
JO  - American Journal of Construction and Building Materials
SP  - 40
EP  - 52
PB  - Science Publishing Group
SN  - 2640-0057
UR  - https://doi.org/10.11648/j.ajcbm.20250902.12
AB  - Intersections are one of the most crucial parts of urban transportation systems since they actively contribute to developing strategies to reduce traffic congestion. One of the major issues that nations around the world face is traffic congestion on roads and intersections. More than 90% of intersections on high-speed roads in developing countries have poor turning space, compared to 64% in developed countries. This study evaluates the performance of major intersections for improving traffic safety and efficiency in Shashemene Town. The objective of this study was to assess current traffic flow patterns, evaluate the effectiveness of existing traffic control measures, and propose potential improvements to enhance safety and efficiency at the selected major intersections. The scope of the study was limited to the three major intersections in Shashemene Town, such as Awasho Roundabout, Abosto Intersection, and Semaniya-Andi Intersection, with a focus on understanding the challenges faced in this urban context. The data were collected using a combination of traffic volume counts and user surveys during peak traffic hours. The SIDRA Intersection Version 8.0 software was employed to evaluate key performance indicators, including travel time, delay, travel speed, LOS, and V/C ratio. The analysis revealed significant congestion at the Awasho Roundabout, with an average travel speed of 35 Kph, a control delay of 24.1 s/veh, LOS C, and a V/C ratio of 0.81. The Abosto Intersection showed moderate delays with a delay of 34.1 s/veh, LOS D, and a V/C ratio of 0.98, while the Semaniya-Andi Intersection performed the best with a delay of 12.8 s/veh, LOS B, and a V/C ratio of 0.64. The findings indicate that while the Semaniya-Andi Intersection operates within acceptable performance levels, the Awasho Roundabout is severely congested, necessitating immediate interventions. To guide drivers, install clear and visible road markings, and ensure pedestrian safety. Installing well-marked pedestrian crossings improves traffic safety and efficiency of the roundabout as a short-term intervention. As a long-term improvement, redesigning the roundabout to accommodate higher traffic volumes and improve flow.
VL  - 9
IS  - 2
ER  -
Copy
|
Download