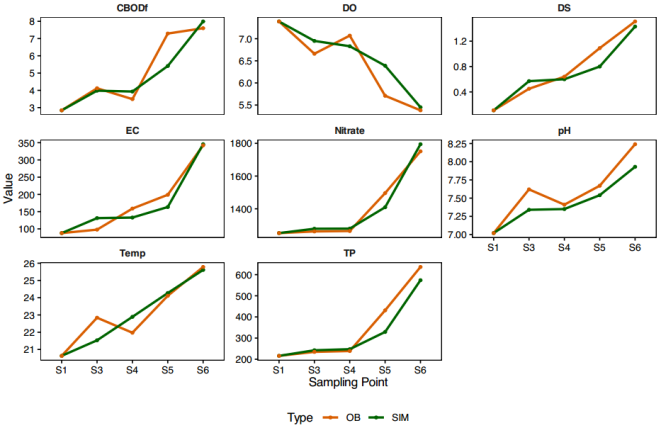
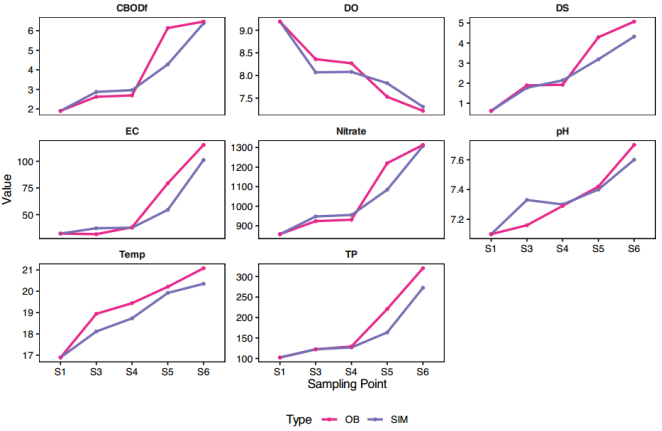
This study applied the QUAL2K water quality model to investigate the pollutant dispersion dynamics in River Sosiani, a vital freshwater source in western Kenya. The river, which historically supported diverse domestic, agricultural and recreational uses for the Eldoret City residents, is currently facing severe degradation due to urbanization and inadequate waste management practices. The model was calibrated and validated using weekly field data collected over six months from designated sampling points. Model performance was evaluated using standard statistical measures, including the R-Squared correlation (R2), the Nash-Sutcliffe efficiency (NSE), and the ratio of the Root Mean Square Error to the observations’ standard deviation (RSR). The results demonstrated good to excellent performance, with R2 values ranging from 0.82 to 0.95, NSE value above 0.75, and RSR values below 0.5 confirming the model’s reliability in simulating the rivers pollutant dispersion dynamics. The simulation results revealed deterioration in water quality from upstream to downstream. Precisely, dissolved oxygen (DO) decreased significantly along the river course, while carbonaceous biochemical oxygen demand (CBODf), electrical conductivity (EC), temperature, total phosphate (TP), and nitrate-nitrogen (NO3-N) concentration all increased. pH remained within the neutral to slightly alkaline range, with some localized shifts downstream, while flow discharge (DS) increased progressively from upstream to downstream. These trends, revealing an increasing pollution load, mainly in urbanized areas, highlight the significant impact of anthropogenic activities on River Sosiani ecological health and underline the urgent need for targeted interventions to mitigate further degradation.
| Published in | American Journal of Water Science and Engineering (Volume 11, Issue 4) |
| DOI | 10.11648/j.ajwse.20251104.12 |
| Page(s) | 122-129 |
| Creative Commons |
This is an Open Access article, distributed under the terms of the Creative Commons Attribution 4.0 International License (http://creativecommons.org/licenses/by/4.0/), which permits unrestricted use, distribution and reproduction in any medium or format, provided the original work is properly cited. |
| Copyright |
Copyright © The Author(s), 2025. Published by Science Publishing Group |
QUAL2K Model, River Sosiani, Water Quality Parameters, Pollutant Dispersion, Performance Evaluation, Modelling
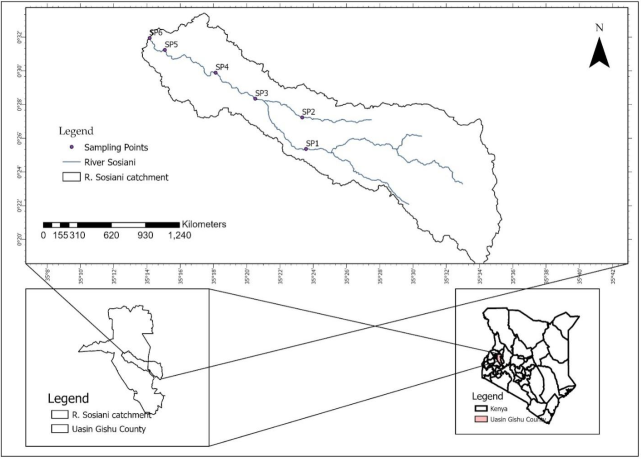
Sampling point | Location | Description |
|---|---|---|
SP1 | Plateau bridge, upstream of River Endoroto | Wetland and minimal anthropogenic activity |
SP2 | Naiberi bridge, upstream of River Ellegerini | Forest and minimal anthropogenic activity |
SP3 | Kolol bridge, immediately after the Two Rivers Dam | Livestock farming and agricultural zone |
SP4 | Annex bridge | Agricultural and carwash zone |
SP5 | West indies bridge | Urban runoff, industrial effluent hotspot and residential discharge |
SP6 | Solo bridge in Huruma | Informal settlement, solid waste leachate exposure and municipal effluent discharge zone |
Sampling point | Season | Parameter | |||||||
|---|---|---|---|---|---|---|---|---|---|
DO (mg/L) | CBODf (mg/L) | Temp (°C) | EC (µS/cm) | pH | NO3-N (mg/L) | TP (mg/L) | DS (m3/s) | ||
SP1 | Dry | 7.39 | 1.94 | 20.49 | 87.78 | 7.02 | 1.25 | 0.22 | 0.01 |
Wet | 9.19 | 1.30 | 16.89 | 32.35 | 7.10 | 0.86 | 0.10 | 0.62 | |
SP2 | Dry | 7.88 | 1.72 | 19.10 | 76.67 | 6.91 | 0.94 | 0.13 | 0.04 |
Wet | 8.91 | 1.06 | 17.39 | 27.65 | 7.10 | 0.52 | 0.06 | 0.60 | |
SP3 | Dry | 6.66 | 2.82 | 24.07 | 97.78 | 7.62 | 1.26 | 0.23 | 0.05 |
Wet | 8.36 | 1.8 | 18.94 | 31.76 | 7.16 | 0.92 | 0.12 | 1.89 | |
SP4 | Dry | 7.07 | 2.39 | 21.97 | 158.89 | 7.41 | 1.26 | 0.24 | 0.06 |
Wet | 8.27 | 1.84 | 19.44 | 38.24 | 7.29 | 0.93 | 0.13 | 1.92 | |
SP5 | Dry | 5.71 | 4.99 | 24.11 | 198.89 | 7.67 | 1.5 | 0.43 | 1.09 |
Wet | 7.53 | 4.21 | 20.21 | 79.41 | 7.42 | 1.22 | 0.22 | 4.29 | |
SP6 | Dry | 5.38 | 5.2 | 25.78 | 342.22 | 8.24 | 1.75 | 0.64 | 1.51 |
Wet | 7.22 | 4.43 | 21.08 | 115.29 | 7.72 | 1.31 | 0.32 | 5.07 | |
Evaluation Statistics | Modelling Phase | Parameters | |||||||
|---|---|---|---|---|---|---|---|---|---|
DS | Temp | EC | DO | CBODf | NO3-N | TP | PH | ||
R2 | Calibration | 0.94 | 0.84 | 0.93 | 0.84 | 0.82 | 0.95 | 0.95 | 0.95 |
Validation | 0.92 | 0.96 | 0.95 | 0.91 | 0.84 | 0.9 | 0.96 | 0.86 | |
RSR | Calibration | 0.26 | 0.37 | 0.24 | 0.4 | 0.4 | 0.2 | 0.3 | 0.45 |
Validation | 0.33 | 0.38 | 0.35 | 0.27 | 0.39 | 0.31 | 0.37 | 0.37 | |
NSE | Calibration | 0.91 | 0.83 | 0.93 | 0.8 | 0.8 | 0.95 | 0.89 | 0.75 |
Validation | 0.86 | 0.82 | 0.92 | 0.91 | 0.81 | 0.88 | 0.83 | 0.83 | |
CBODf | Carbonaceous Biochemical Oxygen Demand |
DO | Dissolved Oxygen |
DS | Flow Discharge |
EC | Electrical Conductivity |
NSE | The Nash-Sutcliffe efficiency |
R2 | R-squared Correlation |
RSR | The RMSE-observations Standard Deviation Ratio |
TP | Total Phosphate |
| [1] | N. Singh, T. Poonia, S. S. Siwal, A. L. Srivastav, H. K. Sharma, and S. K. Mittal, "Challenges of water contamination in urban areas," in Current directions in water scarcity research, vol. 6: Elsevier, 2022, pp. 173-202. |
| [2] | M. Okori, J. Kollongei, and J. Langat, "ANALYSIS OF SPATIOTEMPORAL VARIATION OF RIVER SOSIANI WATER QUALITY IN WESTERN KENYA," Journal of Engineering in Agriculture and the Environment, vol. 10, no. 3, 2025. |
| [3] | M. M. Ghangrekar, "Self-Purification of Natural Streams," in Wastewater to Water: Principles, Technologies and Engineering Design: Springer, 2022, pp. 207-223. |
| [4] | J. Jepkoech, "Selected heavy metals in water and sediments and their bioconcentrations in plant (Polygonum pulchrum) in Sosiani River, Uasin Gishu County, Kenya," University of Eldoret, 2013. |
| [5] | E. J. Masakha, "Longitudinal and seasonal variations in physicochemical and microbiological properties of water quality of sosiani river, Uasin Gishu County, Kenya," Egerton University, 2019. |
| [6] | G. Ontumbi, C. Nyabero, and C. C. Sang, "An assessment of water quality variation on human health in the river sosiani catchment, Kenya," Int. J. Innov. Res. Educ. Sci, vol. 2, pp. 63-68, 2015. |
| [7] | E. N. Munene, N. O. Hashim, and W. N. Ambusso, "Human health risk assessment of heavy metal concentration in surface water of Sosian river, Eldoret town, Uasin-Gishu County Kenya," MethodsX, vol. 11, p. 102298, 2023. |
| [8] | O. J. Oduor, K. D. Kinuthia, and D. N. Wachira, "Assimilation of pollution loading on Sosiani River in Eldoret Municipality, Kenya: as a wastewater management strategy," American Journal of Water Resources, vol. 7, no. 4, pp. 155-162, 2019. |
| [9] | APHA, "Standard methods for the examination of water and wastewater," 2012. |
| [10] | D. W. Meals and S. Dressing, "Surface water flow measurement for water quality monitoring projects," Tech Notes, vol. 3, pp. 1-16, 2008. |
| [11] | S. C. Chapra, G. Pelletier, and H. Tao, "QUAL2K: A modeling framework for simulating river and stream water quality, version 2.11: Documentation and users manual," Civil and Environmental Engineering Dept., Tufts University, Medford, MA, vol. 109, 2008. |
| [12] | P. B. Parajuli, N. O. Nelson, L. D. Frees, and K. R. Mankin, "Comparison of AnnAGNPS and SWAT model simulation results in USDA‐CEAP agricultural watersheds in south‐central Kansas," Hydrological Processes: An International Journal, vol. 23, no. 5, pp. 748-763, 2009. |
| [13] | C. Hesse, V. Krysanova, and A. Voß, "Implementing in-stream nutrient processes in large-scale landscape modeling for the impact assessment on water quality," Environmental Modeling & Assessment, vol. 17, pp. 589-611, 2012. |
| [14] | D. N. Moriasi, M. W. Gitau, N. Pai, and P. Daggupati, "Hydrologic and water quality models: Performance measures and evaluation criteria," Transactions of the ASABE, vol. 58, no. 6, pp. 1763-1785, 2015. |
| [15] | A. S. Mustafa, S. O. Sulaiman, and S. H. Shahooth, "Application of QUAL2K for Water Quality Modeling and Management in the lower reach of the Diyala river," Iraqi J. Civ. Eng, vol. 11, pp. 66-80, 2017. |
| [16] | H. Aminirad et al., "Investigation of self-purification capacity and water quality of Haraz river during dry and wet season," Journal of Applied Research in Water and Wastewater, vol. 8, no. 1, pp. 21-27, 2021. |
| [17] | J. L. Jitolis, A. N. A. Ali, and N. Bolong, "Water quality modelling using QUAL2K at Likas River, Sabah," Transactions on Science and Technology, vol. 8, no. 3-2, pp. 363-371, 2021. |
APA Style
Okori, M., Kollongei, J. K. (2025). Application of the QUAL2K Water Quality Model to Assess Pollutant Dispersion in River Sosiani in Western Kenya. American Journal of Water Science and Engineering, 11(4), 122-129. https://doi.org/10.11648/j.ajwse.20251104.12
ACS Style
Okori, M.; Kollongei, J. K. Application of the QUAL2K Water Quality Model to Assess Pollutant Dispersion in River Sosiani in Western Kenya. Am. J. Water Sci. Eng. 2025, 11(4), 122-129. doi: 10.11648/j.ajwse.20251104.12
@article{10.11648/j.ajwse.20251104.12,
  author = {Maemba Okori and Julius Kipkemboi Kollongei},
  title = {Application of the QUAL2K Water Quality Model to Assess Pollutant Dispersion in River Sosiani in Western Kenya
},
  journal = {American Journal of Water Science and Engineering},
  volume = {11},
  number = {4},
  pages = {122-129},
  doi = {10.11648/j.ajwse.20251104.12},
  url = {https://doi.org/10.11648/j.ajwse.20251104.12},
  eprint = {https://article.sciencepublishinggroup.com/pdf/10.11648.j.ajwse.20251104.12},
  abstract = {This study applied the QUAL2K water quality model to investigate the pollutant dispersion dynamics in River Sosiani, a vital freshwater source in western Kenya. The river, which historically supported diverse domestic, agricultural and recreational uses for the Eldoret City residents, is currently facing severe degradation due to urbanization and inadequate waste management practices. The model was calibrated and validated using weekly field data collected over six months from designated sampling points. Model performance was evaluated using standard statistical measures, including the R-Squared correlation (R2), the Nash-Sutcliffe efficiency (NSE), and the ratio of the Root Mean Square Error to the observations’ standard deviation (RSR). The results demonstrated good to excellent performance, with R2 values ranging from 0.82 to 0.95, NSE value above 0.75, and RSR values below 0.5 confirming the model’s reliability in simulating the rivers pollutant dispersion dynamics. The simulation results revealed deterioration in water quality from upstream to downstream. Precisely, dissolved oxygen (DO) decreased significantly along the river course, while carbonaceous biochemical oxygen demand (CBODf), electrical conductivity (EC), temperature, total phosphate (TP), and nitrate-nitrogen (NO3-N) concentration all increased. pH remained within the neutral to slightly alkaline range, with some localized shifts downstream, while flow discharge (DS) increased progressively from upstream to downstream. These trends, revealing an increasing pollution load, mainly in urbanized areas, highlight the significant impact of anthropogenic activities on River Sosiani ecological health and underline the urgent need for targeted interventions to mitigate further degradation.
},
 year = {2025}
}
TY  - JOUR
T1  - Application of the QUAL2K Water Quality Model to Assess Pollutant Dispersion in River Sosiani in Western Kenya

AU  - Maemba Okori
AU  - Julius Kipkemboi Kollongei
Y1  - 2025/10/27
PY  - 2025
N1  - https://doi.org/10.11648/j.ajwse.20251104.12
DO  - 10.11648/j.ajwse.20251104.12
T2  - American Journal of Water Science and Engineering
JF  - American Journal of Water Science and Engineering
JO  - American Journal of Water Science and Engineering
SP  - 122
EP  - 129
PB  - Science Publishing Group
SN  - 2575-1875
UR  - https://doi.org/10.11648/j.ajwse.20251104.12
AB  - This study applied the QUAL2K water quality model to investigate the pollutant dispersion dynamics in River Sosiani, a vital freshwater source in western Kenya. The river, which historically supported diverse domestic, agricultural and recreational uses for the Eldoret City residents, is currently facing severe degradation due to urbanization and inadequate waste management practices. The model was calibrated and validated using weekly field data collected over six months from designated sampling points. Model performance was evaluated using standard statistical measures, including the R-Squared correlation (R2), the Nash-Sutcliffe efficiency (NSE), and the ratio of the Root Mean Square Error to the observations’ standard deviation (RSR). The results demonstrated good to excellent performance, with R2 values ranging from 0.82 to 0.95, NSE value above 0.75, and RSR values below 0.5 confirming the model’s reliability in simulating the rivers pollutant dispersion dynamics. The simulation results revealed deterioration in water quality from upstream to downstream. Precisely, dissolved oxygen (DO) decreased significantly along the river course, while carbonaceous biochemical oxygen demand (CBODf), electrical conductivity (EC), temperature, total phosphate (TP), and nitrate-nitrogen (NO3-N) concentration all increased. pH remained within the neutral to slightly alkaline range, with some localized shifts downstream, while flow discharge (DS) increased progressively from upstream to downstream. These trends, revealing an increasing pollution load, mainly in urbanized areas, highlight the significant impact of anthropogenic activities on River Sosiani ecological health and underline the urgent need for targeted interventions to mitigate further degradation.

VL  - 11
IS  - 4
ER  -
Department of Agricultural and Biosystems Engineering, University of Eldoret, Eldoret City, Kenya
Department of Agricultural and Biosystems Engineering, University of Eldoret, Eldoret City, Kenya
Information