Research Article | | Peer-Reviewed

Synthesis and Characterisation of Methyl Violet/Cyclodextrin Doped ZnO Nanocrystals

Received: 8 May 2025     Accepted: 22 May 2025     Published: 20 June 2025
Views:       Downloads:
Abstract

Methyl violet/ cyclodextrin doped on ZnO nanocrystals were synthesized and characterized by various spectral and microscopic methods. The effect of different polarity of the solvents, α-cyclodextrin (α-CD) and β-cyclodextrin (β-CD) on MV were studied by various spectral methods. The inclusion behaviour of MV on both CDs were determined by PM3 method. Doping effect of MV/CD on ZnO nano investigated by UV-visible, fluorescence, FTIR, DTA, XRD, FE-SEM and TEM methods. MV molecule exhibits dual emission in all the solvents, α-CD and β-CD while three absorption maxima noticed in the ground state. The normal Stokes shifted band was originated from the locally excited state and the large Stokes shifted band was due to the emission from a twisted intramolecular charge transfer (TICT) state. Presence of isosbestic point suggest 1:1 inclusion complex is formed. HOMO-LUMO gap for MV/β-CD inclusion complex was more negative, which support that this complex is more stable than MV/α-CD inclusion complex. A red or blue shifted absorption and fluorescence maximum was seen in β-CD/MV/ZnO nanocrystals than MV/CD. Nanoparticle size was measured by TEM-EDS and X-RD methods. TEM image showed nanocrystals are formed in ZnO/MV/β-CD.

Published in Colloid and Surface Science (Volume 7, Issue 1)
DOI 10.11648/j.css.20250701.12
Page(s) 19-30
Creative Commons

This is an Open Access article, distributed under the terms of the Creative Commons Attribution 4.0 International License (http://creativecommons.org/licenses/by/4.0/), which permits unrestricted use, distribution and reproduction in any medium or format, provided the original work is properly cited.

Copyright

Copyright © The Author(s), 2025. Published by Science Publishing Group

Keywords

Methyl Violet, Zinc Oxide Nano, Cyclodextrin, Inclusion Complex, Nanocrystal

1. Introduction
Nanosized particles of semiconductor materials have gained much more interest due to their desirable properties and applications in different areas such as catalysts , sensors , photoelectron devices , highly functional and effective devices . These nanomaterials have novel electronic, structural, and thermal properties which are of high scientific interests in basic and applied fields. Zinc oxide (ZnO) is a wide band gap semiconductor with an energy gap of 3.37 eV at room temperature. It has been used considerably for its catalytic, electrical, optoelectronic, and photochem ical properties . ZnO nanostructures have a great advantage to apply to a catalytic reaction process due to their large surface area and high catalytic activity . Since zinc oxide shows different physical and chemical properties depending upon the morphology of nano structures, not only various synthesis methods but also the physical and chemical properties of synthesized zinc oxide are to be investigated in terms of its morphology.
When doping on the nanomaterials, reduce the size to nanoscale and modify their chemical, mechanical, electrical, structural, morphological, and optical properties. These modified features allow the nanoparticles to interact in a unique manner with doping molecules and thus facilitate the physical transfer of nanoparticles into the structures . Nanostructured materials have a larger percentage of atoms at their surface which lead to high surface reactivity. Thus, nanomaterials have witnessed recently significant importance in the basic and applied sciences as well as in bio-nanotechnology. Zinc oxide nanoparticles (ZnO NPs), as one of the most important metal oxide nanoparticles, are popularly employed in various fields due to their peculiar physical, chemical and spectral properties . Because of the strong UV absorption properties of ZnO, they are increasingly used in personal care products, such as cosmetics, sunscreen, antibacterial, antimicrobial, deodorant, concrete production, photocatalysis, electronics, electrotechnology industries, excellent UV blocking and so on .
The aim of this work is to investigate the possibility of obtaining MV/CD covered ZnO. Additionally, the present work is based on an integrated experimental-computational approach. As compared to the previously used pure experimental approaches, the integrated experimental-computational approach not only demonstrates some macroscopic information about the solubility and possible intermolecular interactions through wet experimental measurements but also provides valuable information about the microscopic binding through the computational modeling. Because of the above reasons, the present study: (i) analyze the effect of three –N(CH3)2 groups on the TICT emission in the methyl violet (4-[[4-(dimethylamino) phenyl]-(4-methyliminocyclohexa-2,5-dien-1-ylidene) methyl]-N,N-dimethyl aniline; hydrochloride or Tris (4-(dimethyl amino) phenyl) methylium chloride or 4-{Bis [4-(dimethyl amino) phenyl] methylidene}-N,N-dimethylcyclohexa-2,5-dien-1-iminium chloride, MV) (Figure 1)) molecule, (ii) find the inclusion complexes whether increase or decrease the dual emission, (iii) analyse the doping effect of MV/CD on ZnO nanoparticles, and iv) find which type of nanomaterial is formed.
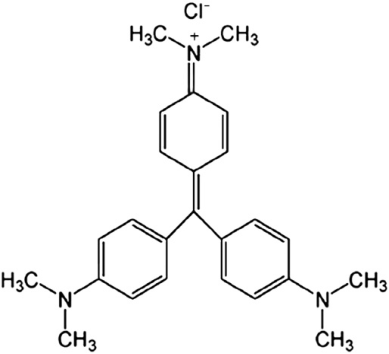
Figure 1. Chemical structure of methyl violet [MV].
2. Experimental
2.1. Preparation of Drug/CD Inclusion Complex in Solution
Different concentrations of α-CD or β-CD solution (0.1 to 1.0×10⁻² M) were taken in 10 ml standard measuring flask. MV stock solution have a concentration of 2×10⁻² M. 0.2 ml of the MV stock solution was added to the above flasks. The mixed solution was made up to 10 ml with triple-distilled water and shaken very well. The final MV concentration in each flask was 4×10⁻⁴ M and 298 K temperature was used for the experiments.
2.2. Molecular Modeling Studies
Using the molecular modeling software Spartan 08, the molecular geometry of MV, CD and its inclusion complexes were analyzed. The most stable complexation energy was determined theoretically after the structural assembly of two orientation inclusion complexes using the semi-empirical PM3 method in the gas phase and Gaussian 09W software.
2.3. Preparation of ZnO and MV/CD Doped ZnO Nanomaterials
0.01 M of zinc sulphate and NaOH (1%) solution with a molar ratio of 1:2, which was carried out under vigorous stirring for 12 h at 50 to 60°C temperature. The obtained white precipitate (ZnO) was washed several times and separated by centrifugation . Finally, the precipitate was dried in an oven at 100°C for 6 h. The prepared ZnO nanoparticles showed a size distribution about 25-50 nm.
MV (2×10⁻³ M) was dissolved in 20 ml of ethanol and gradually added to the CD (1×10⁻² M) in 80 ml deionized water. Then 0.01 M zinc sulphate (100 ml) was added to the above MV/CD solution. Using a hot plate with magnetic stirrer, this mixture was heated to 50°C for one hour. With vigorous stirring, one or two ml of 1% sodium hydroxide was added and stirred one to two hours. After that, the above solution was frozen and dried (mini-lyophilized) at -80°C. The powder MV/CD/ ZnO sample was collected and used for further analysis. The scheme is given in Figure 2:
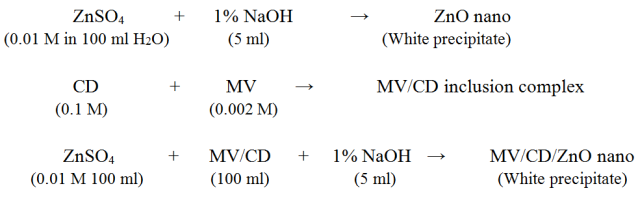
Figure 2. Preparation of MV/CD doped ZnO nanocrystals.
3. Result and Discussion
3.1. Effect of Solvents, α-CD and β-CD
The absorption and emission spectra of the MV was examined in different polarity of the solvents, α-CD and β-CD (Table 1, Figure 3). In water, α-CD and β-CD, the absorption maxima of MV were appearing at 571, 298, 242 nm, while dual emission appeared at 415, 355 nm. The 571 nm absorption wavelength is non fluorescent, hence the longer emission is lower than absorption wavelength. Upon increasing the CD concentrations: i) no noteworthy absorption and emission spectral changes were noticed in MV, however the absorbance decreased in α-CD but increased in β-CD at the same wavelength, ii) the emission intensity regularly decreased at the same wavelength indicating that MV molecule was entrapped into the CD cavities . The absorption and emission spectral shifts and shape of MV with α-CD or β-CD is same indicate that both CDs are formed similar type of the inclusion complex.
Table 1. Absorption and fluorescence spectral maxima of MV with different Solvents.

Solvents

abs

log

flu

Cyclohexane

571

300

250

3.03

2.77

2.95

345

430

1,4-Dioxane

569

299

245

3.36

2.87

2.78

345

430

Ethyl acetate

571

300

251

3.03

2.77

2.87

345

430

Acetonitrile

569

299

245

3.29

2.91

2.95

345

430

2-Propanol

571

300

246

3.26

2.77

2.75

345

430

Ethanol

571

300

242

3.24

2.68

2.73

345

430

Water

571

298

242

4.01

3.56

3.64

355

415

[α-CD] 0.01 M

572

297

243

3.74

3.24

3.13

355

415

[β-CD] 0.01 M

573

298

244

4.26

3.79

3.78

355

415

α-CD

K (1:1) x105 M-1

81

-

240

β-CD

K (1:1) x105 M-1

113

-

229

α-CD

G (kcalmol-1)

-12.9

-

-15.7

β-CD

G (kcalmol-1)

-13.8

-

-15.6

Excitation wavelength (nm)

-

-

300

K (1:1) x105 M-1 – binding constant for 1:1 inclusion complex;
G – Gibbs free energy.
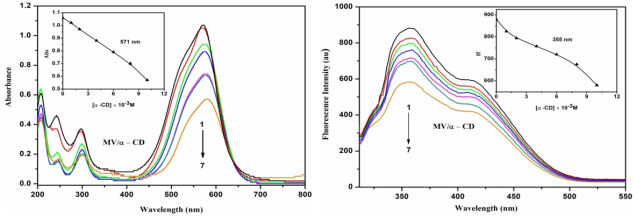
Figure 3. Absorption and fluorescence spectra of MV in different α-CD concentrations (M): (1) 0, (2) 0.001, (3) 0.002, (4) 0.004, (5) 0.006, (6) 0.008, (7) 0.01. Insert figure: absorbance/ Fluorescence Intensity vs [α-CD].
MV consists of three absorption maxima in all the solvents and no significant spectral changes were noticed in the ground state. In the excited state, dual emission was noticed in all the solvents; the shorter wavelength (SW) locally excited (LE) band is red shifted from cyclohexane to water (345 to 355 nm), while longer wavelength (LW) or TICT band is blue shifted (430 to 415 nm). The emission intensity of the SW is higher than LW. The absorption and emission spectral shifts in the solvents are different from the CD solution suggest MV molecule encapsulated in the CD cavity . The area of the SW and the TICT bands decreases with the increase in the polarity and hydrogen bonding capacity of the solvents but it increases in water.
Upon addition of α-CD and β-CD, both the normal and TICT emissions were decreased, while the emission maxima remain relatively unchanged. The fluorescence intensity ratio of the TICT band and the normal band (TICT/SW) were same when the concentration of α-CD and β-CD increases. It is also noteworthy that the both normal and TICT emission intensities are almost same in α-CD and β-CD solutions. These similar spectral changes in α-CD and β-CD solutions suggest that the structural geometry of the both inclusion complexes are same in terms of the orientation of guest molecules.
The above results explained as follows: two kinds of rotational motions are possible in MV for the origination of the TICT band: (a) rotation of the –N(CH3)2 group around the C–N bond and (b) rotation of the complete aniline moiety (C6H4–N(CH3)2) around the C–N bond. Further, if rotation had occurred around the –N(CH3)2 bond, a blue-shift in the position of SW band should have been observed. Thus, it would be reasonable to mention that the rotation of the complete aniline moiety (C6H4–N(CH3)2) is responsible for the TICT emission and not the rotation of the aniline ring around the C–N(CH3)2 bond. The emission intensity of TICT and SW should increase in going from non-polar to water. Due to TICT state, the dipole moment and the dipolar interactions will increase with the increase in polarity of the solvents. Thus, the decrease in the fluorescence intensity of the longer wavelength band in polar solvents could be due to large stabilization of the highly polar TICT state by strong dipole–dipole and hydrogen bonding interaction and consequent rapid non-radiative transition to the ground and/or low-lying triplet states .
Further, to get a better understanding of the structure of the MV, the molecular modeling geometry optimization were carried out in PM3 method. The optimized structure shows all the three aniline moieties (C6H4–N(CH3)2) are present in different manner (Figure 4). The internal diameter of the α-CD and β-CD is approximately 5.6 and 6.5 Å and the height is 7.8 Å respectively. This calculation revealed that the diameter of MV, horizontal bond length is 11.95 Å and the vertical bond distance is 12.31 Å. The horizontal and vertical bond length of MV is longer than the dimensions of the α-CD and β-CD cavities, hence, this molecule is partially encapsulated in the CD cavity. Therefore, any one of the aniline moieties (C6H4–N(CH3)2) is entrapped in the α-CD or β-CD cavity and the other aniline moieties exposed to the bulk phase. The bond angles and dihedral angles were also twisted as like other TICT molecules. As mentioned in the above results predict the dual emission causes due to presence of TICT present in this molecule.
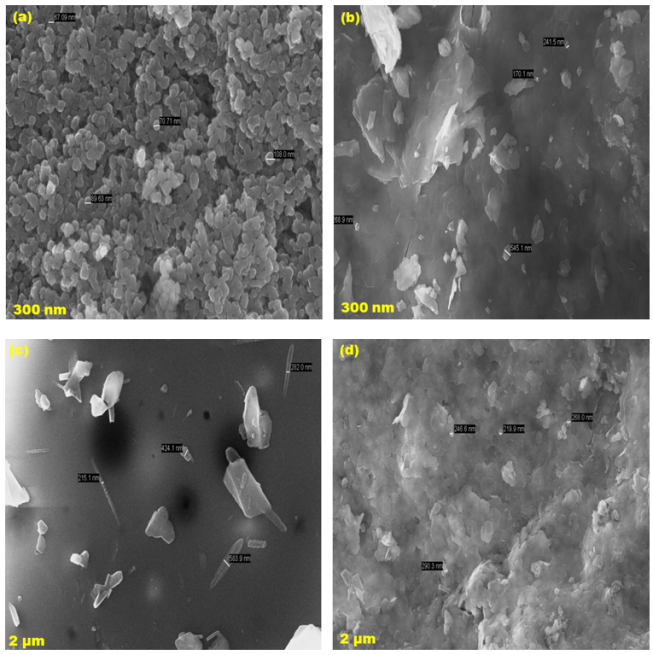
Figure 4. PM3 optimized structures of (a) MV, (b) HOMO, LUMO and (c) MEP of MV. The blue color indicates for nitrogen atom, while in HOMO-LUMO, the green and red colors denote negative and positive phases of the molecules. The red color in the molecular electrostatic potential's (MEP) figure shows that the electronegative charge of the atoms is greater than that of other atoms.
Three types of inclusion complex formation between the MV and CDs are possible because all the aniline moieties are same size: i) any one of the aniline moiety (C6H4–N(CH3)2) of the MV may captured and form 1:1 (MV:CD) inclusion complex; ii) two aniline moieties from the MV may form 1:2 (MV:2CD) inclusion complex; iii) all the three aniline moieties of the MV may form 1:3 (MV:3CD) inclusion complex. Since all the three aniline moieties have similar chemical structure, the MV have same orientations of MV in α-CD and β-CD, hence, the absorption and emission maxima of MV in the presence of CD showed same value as compared with that in the absence of CD. As long as the other aniline moieties (C6H4–N(CH3)2) is exposed to water, the magnitude of the contribution of the fast relaxational process to form the TICT state stays the same as observed in the α-CD and β-CD. This may be also responsible for the formation of similar type of inclusion complexes in the CD solution. From the slope and intercept of the Benesi-Hildebrand plot [1/(A-A0) vs 1/[CD] or 1/[CD]2 and 1/(I-I0) vs 1/[CD] or 1/[CD]2], the binding constant for the inclusion complexes was determined. The presence of an isosbestic point in the absorption spectrum confirms the formation of a 1:1 inclusion complex .
3.2. Molecular Modeling
The ground state geometries of MV, α-CD, β-CD and their inclusion complexes were optimized by PM3 method. HOMO, LUMO, energy, enthalpy, entropy, free energy, dipole moment, zero-point vibrational energy and Mullikan charge values for the MV, α-CD, β-CD and the inclusion complexes are all listed in Table 2. When MV entered in to the CD cavity, the polarity and the above parameter values for MV, α-CD, β-CD significantly changed in the inclusion complexes. The ΔE, ΔG and ΔH values for the MV/β-CD inclusion complexes is more negative than MV/α-CD and cavity. The negative Gibbs energy and enthalpy of the inclusion complexes indicate that the formation of the complex is spontaneous and exothermic. The negative entropy (ΔS) effect may be due to the disorder of the system. The energy gap between HOMO and LUMO of the complexes suggests that there will be a significant change in the electronic structures of the guest molecules while molecular recognition and binding. Figure 4 illustrates the HOMO-LUMO energy orbital pictures of all the inclusion complexes have significantly varied. The large (EHOMO-ELUMO) values tend to have higher stability than isolated MV molecule. HOMO-LUMO gap for MV/β-CD inclusion complex was more negative, which supports that this complex is more stable than MV/α-CD inclusion complexes.
Table 2. Energetic features, thermodynamic parameters and HOMO-LUMO energy calculations for MV and its inclusion complexes by semiempirical PM3 method.

Properties

MV

α-CD

β-CD

MV/α-CD

MV/β-CD

EHOMO (eV)

-7.84

-10.37

-10.35

-8.30

-7.03

ELUMO (eV)

-2.19

1.26

1.23

-0.64

-2.66

EHOMO – ELUMO (eV)

5.64

-11.63

-11.58

7.66

4.36

Dipole (D)

14.14

11.34

12.29

11.33

18.24

E (kcal mol-1)

-95.75

-1247.62

-1457.63

-1176.13

-1390.00

ΔE (kcal mol-1)

-

-

-

-24.26

-28.12

G (kcal mol-1)

-326.65

-676.37

-789.52

-1007.1

-1214.80

ΔG (kcal mol-1)

-

-

-

-4.29

-98.63

H (kcal mol-1)

-266.43

-570.84

-667.55

-856.99

-853.66

ΔH (kcal mol-1)

-

-

-

-19.72

-80.32

S (kcal/mol-Kelvin)

0.201

0.353

0.409

0.504

0.490

ΔS (kcal/mol-Kelvin)

-

-

-

0.05

0.12

ZPE

307.61

635.09

740.56

946.51

1156.28

kcal/mol; **kcal/mol-Kelvin; ZPE = Zero-point vibration energy
3.3. MV/CD Doping Effect on ZnO Nanoparticles
In solution phase, the absorption and emission spectra of the ZnO, ZnO/MV, ZnO/β-CD, β-CD/MV/ZnO nanoparticles are analyzed. Absorption and emission band of ZnO nanoparticle appears at 320 nm and 420, 355 nm respectively . When MV solution was added to the ZnO nano solution, the above absorption and emission maxima red shifted to 566, 297 nm and 575, 387 nm respectively. With addition of β-CD solution to the ZnO nano, the absorption and emission maxima shifted to 250 and 398 nm respectively. When MV/β-CD solution was added to the ZnO nano, the absorption and the emission maxima red shifted to 575, 358, 297, 243 nm and, 598 nm respectively. The above red or blue shifts in the absorption and emission spectra suggest that MV and CD doped and interact with ZnO nanoparticles.
3.4. FE-SEM and EM Images
ZnO nano, MV, β-CD/ZnO and β-CD/MV/ZnO nanomaterials were examined by FE-SEM and EDAX (Figure 5). ZnO particles form small size balls present in cluster shape; When β-CD doped on ZnO, the image is appeared in the sheet shape whereas pure MV molecules shown in the nano stone shape image. When MV/CD doped on ZnO, the image is appeared in cloud shape. As per the FE-SEM-EDAX data, (a) ZnO nano contains 57.34% zinc and 42.66% oxygen, (b) β-CD/ZnO nano comprises 19.67% zinc, 54.42% oxygen and 25.91% carbon, (c) MV dye contains 70.81% carbon, 21.72% nitrogen, 7.47% chlorine and (d) β-CD/MV/ZnO contains 23.00% zinc, 20.94% carbon, 51.54% oxygen, 4.22% nitrogen and 0.30% chlorine. FE-SEM pictures and the atom composition of the nano ZnO, MV are different from β-CD/MV/ZnO conform the formation of new nanomaterials.
Figure 4. SEM images for (a) ZnO, (b) β-CD/ZnO, (c) MV, (d) β-CD/MV/ZnO.
TEM images of ZnO, β-CD/ZnO and β-CD/MV/ZnO are displayed in Figure 6. Nano sheet like structures found in the ZnO nanomaterials while nanorod like structure is formed in ZnO/β-CD. Nanosheet image is present in ZnO (particles size - 20 nm to 44 nm), whereas uniformly spherical particles present in β-CD/ZnO nano (particles size -20 to 40 nm) and nanocrystal shape present in β-CD/MV/ZnO (particles size – 20 to 33 nm). TEM-EDX data predict: (a) ZnO nano - 69.84% of zinc nano and 30.16% of oxygen, (b) β-CD/ZnO nano- 8.79% of zinc, 44.59% of oxygen and 46.61% of carbon, (c)) in β-CD/MV/ZnO - 31.71% of zinc, 24.38% of carbon, 38.97% of oxygen, 4.69% of nitrogen and 0.24% of chlorine. The presence of ZnO along with MV/β-CD is confirmed by the EDX data for the metallic nanoparticles.
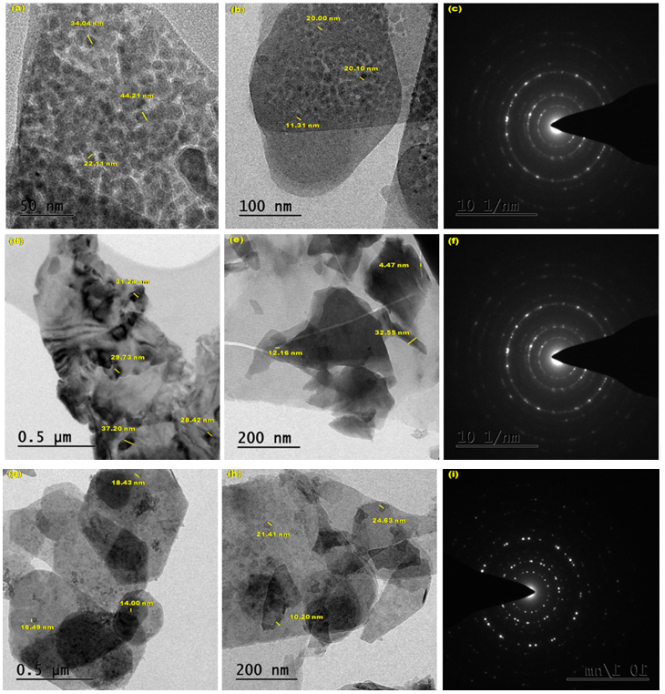
Figure 5. TEM images for (a-c) ZnO, (d-f) β-CD/ZnO, (g-i) β-CD/MV/ZnO.
The nano particles size is also measured in X-RD and HR TEM method. In HR-TEM, IMAGE-J software is used to measure the particle size and average particle size calculated by origin software. The particle size is given below: ZnO nano – 24.98 nm, β-CD/ZnO – 23.98 nm, β-CD/MV/ZnO Nano – 17.47 nm. Compared to XRD method, 3-5 nm particle size is varied in HR-TEM method.
In XRD, Scherer equation is used to calculate the particle size [D = Kλ/βCosθ]. D = Average particle size, K = constant value (0.94). The particle size is given below: ZnO nano – 19.30 nm, β-CD – 23.84, MV- 18.75 nm, β-CD/ZnO - 20.69 nm, and β-CD/MV/ZnO Nano – 13.83 nm.
3.5. Powder X-ray Diffractogram
With the use of the JCPDS: 03-065-3411 data the mineral name (3C) and the development of the hexagonal closely packed (HCP) structure have been confirmed. The JCPDS card number 800-075 was used to index all of the diffraction peaks with its standard ZnO face-centered cube peaks and formed at 60°. The values of the hkl plane are found at (100), (002), (101), (102), (103), (110), (112) and (201) reflection planes of hexagonal structure of ZnO. In ZnO, eight diffraction peaks located at 31.80, 34.51, 36.21, 47.52, 56.61, 62.90, 67.91, 69.92 correspond to the reflection planes of hexagonal structure of ZnO. In β-CD, eight peaks observed at 13.39, 19.93, 23.50, 27.65, 31.96, 35.54, 40.58, 48.90 while in β-CD/ZnO ten peaks formed at 10.15, 15.18, 25.41, 28.38, 34.92, 42.29, 49.77, 59.16, 63.32, 70.33. In MV, four peaks formed at 14.34, 24.86, 28.35, 32.94, whereas in β-CD/MV/ZnO six peaks formed at 31.10, 31.88, 44.80, 45.60, 56.12, 65.82. Compared to isolated MV, the β-CD/MV/ZnO nanomaterial XRD patterns showed a different diffraction pattern and different peak intensities suggesting that nanomaterials were formed. Further, a number of prominent peaks appeared from 10 to 80 degree range supporting the formation of β-CD/MV/ZnO nanomaterials.
3.6. Infrared Spectral Studies
FTIR spectra of ZnO nano, MV, ZnO/MV, β-CD/ZnO and β-CD/MV/ZnO were determined. Due to the conversion of Zn+2 to ZnO nanoparticles, the ZnO nanoparticles were observed at 3325, 1587, 1450, 592, and 513 cm-1. The 3325 cm−1 frequency indicate the presence of ZnO and the peak seen at 592, and 513 cm-1 suggest the presence of Zn nanoparticles. It is already reported, the FTIR spectrum of pure ZnO nanoparticles peak appears at 595 cm−1 was the characteristic absorption of ZnO bond and the broad band peak at 3507 cm−1 can be attributed to the characteristic absorption of O-H group. When β-CD added to zinc oxide nano, the 3325 cm−1 frequency shifted to 3280 cm−1, while 1587, 1450 cm-1 moved to 1614, 1514 cm-1 and 592, 513 cm-1 peaks shifted to 594, 526 cm-1. The above variation in the FTIR frequencies indicate that CD doped on ZnO nano particles.
In MV, primary amino group stretching frequency appears at 3318 cm-1, aromatic ring CH stretching frequency appear weekly around 3000 cm-1, aromatic C=C stretching frequency appear at 1616, 1473 cm-1. Out of plane bending frequency appear at 904, 815 cm-1 and C-N stretching frequency appears at 1288 cm-1, C-NH2 frequency appear at 2860 cm-1, and CH out of plane bending frequency appear at 750, 677 cm-1. When MV/β-CD doped on ZnO nano, the above frequencies are shifted to lower or higher wave numbers; i.e., the primary amino group stretching frequency moved to 3315 cm-1, aromatic ring CH stretching frequency is lost, aromatic ring stretching frequency shifted to 1613, 1482 cm-1. Out of plane bending frequency appear at 1024, 958 cm-1 and C-N stretching frequency appears at 1351 cm-1, and CH out of plane bending frequency appear at 754, 594 cm-1.
3.7. DTA Thermogram
DTA profiles of pure ZnO nano, MV, β-CD/ZnO and β-CD/MV/ZnO are measured. In ZnO nano, two exothermic peaks three endothermic peaks noticed at 226.1, 546.7°C and 272.6, 731.1, 919.2°C respectively. MV exhibits two exothermic peaks at 243.3, 740.4°C while β-CD exhibit one exothermic peak at 128.6°C. In β-CD/ZnO, two exothermic four endothermic peaks appear at 224.3, 932.4°C and 265.2, 354.6, 749.8, 884.1°C respectively. In β-CD/MV/ZnO, each three endothermic and exothermic peaks seen at 267.7, 622.5, 1030.3°C, and 223.1, 575.9, 798.0°C respectively. The endothermic peaks in the inclusion complex nanomaterials are caused by the loss of water from the CDs. In contrast to the pure MV and ZnO new peak arises in β-CD/MV/ZnO conform both MV/CD doped on the ZnO nanomaterials.
4. Conclusion
The following conclusions can be drawn from the study: (i) in all the solvents and CD, dual fluorescence was observed in MV, (ii) The ratio of the TICT emission and the normal emission of MV constant as the CD concentration increases, (iii) The entrapment of the aniline moiety in the CD cavity seems to decrease the TICT process, (iv) Presence of isosbestic point suggest 1:1 inclusion complex is formed, (v) Compared to MV/CD inclusion complex, a red or blue shifted absorption and fluorescence maximum was seen in β-CD/MV/ZnO nanocrystals (vi) TEM image showed nanocrystals are formed in β-CD/MV/ZnO.
Abbreviations

FTIR

Fourier Transform Infrared Spectroscopy

DTA

Differential Thermal Analysis

XRD

X-ray Diffraction

SEM

Scanning Electron Microscopy

TEM

Transmission Electron Microscopy

HOMO

Highest Occupied Molecular Orbital

LUMO

Lowest Unoccupied Molecular Orbital

MV

Mordant Violet

ZnO NPs

Zinc Oxide Nanoparticles

α-CD

Alpha Cyclodextrin

β-CD

Beta Cyclodextrin

PM3

Parametric Method 3

ΔE

Internal Energy Change

ΔH

Enthalpy Change

ΔG

Free Energy Change

ΔS

Entropy Change

Acknowledgments
This work was supported by the Rashtriya Uchchatar Shiksha Abhiyan (RUSA) Phase -2.0 [No. 128/A1/ RUSA 2.0, Health and Environment] New Delhi, India.
Author Contributions
The authors confirm contributions to the paper as follows:
Palanichamy Ramasamy: Experimental study
Ayyadurai Mani, Balakrishnan Sneha, Ezhil Nivetha, Poomalai Senthilraja: Calculation, Analysis, Data Collection
Albert Antony Muthu Prabhu: PM3 calculation
Govindaraj Venkatesh: Data interpretation
Narayanasamy Rajendiran: Manuscript draft preparation, Supervisor
Data Availability Statement
No data was used for the research described in the article.
Conflicts of Interest
The authors declare no conflicts of interest.
References
[1] Joshi SS, Patil PR, Naimase MS, Bakare PP. Role of ligands in the formation, phase stabilization, structural and magnetic properties of α-Fe2O3 nanoparticles. J. Nanopart. Res. 2006; 5: 635–643;
[2] Cheng XL, Zhao H, Huo LH, Gao S, Zhao JG. ZnO nanoparticulate thin film: preparation, characterization and gas-sensing properties. Sens. Actuators B. 2004; 102: 248–252,
[3] Lee SY, Shim ES, Kang HS, Pang SS. Fabrication of ZnO thin film diode using laser annealing. Thin Solid Films. 2005; 437, 31–34,
[4] Wang ZL, Kong XY, Ding Y, Gao P, Hughes WL. Semiconducting and piezoelectric oxide nanostructures induced by polar surfaces. Adv. Funct. Mater. 2004; 14: 943–956,
[5] Huang YH, Zang Y, Liu L, Fan SS, Wei Y, He J. Controlled synthesis and field emission properties of ZnO nanostructures with different morphologies. J. Nanosci. Nanotechnol. 2006; 6: 787–790,
[6] Brida D, Fortunato E, Ferreira I, Aguas H, Martins R. New insights on large area flexible position sensitive detectors. J. Non-Cryst. Solids. 2002; 299, 1272–1276,
[7] Wang ZL. Zinc oxide nanostructures: growth properties and applications. J. Phys. Condens. Matter. 2004; 16: R 829–R 858, https://doi.org/10.1088/0953-8984/16/25/R01
[8] Amna Sirelkhatim, Shahrom Mahmud, Azman Seeni, Noor Haida Mohamad Kaus, Ling Chuo Ann, Siti Khadijah Mohd Bakhori, Habsah Hasan, Dasmawati Mohamad, Review on Zinc Oxide Nanoparticles: Antibacterial Activity and Toxicity Mechanism, Nano-Micro Lett. 2015; 7(3): 219–242.
[9] Rasmussen JW, Martinez E, Louka P, Wingett DG, Zinc oxide nanoparticles for selective destruction of tumor cells and potential for drug delivery applications. Expert Opin. Drug Deliv. 2010; 7(9): 1063–1077.
[10] Mani A, Ramasamy P, Antony Muthu Prabhu A, Rajendiran N, Investigation of Ag and Ag/Co bimetallic nanoparticles with naproxen-cyclodextrin inclusion complex. J. Molecular Structure 2023; 1284: 135301-10.
[11] Mani A, Venkatesh G, Senthilraja P, Rajendiran N, Synthesis and Characterisation of Ag-Co-Venlafaxine-Cyclodextrin Nanorods. European J Advanced Chemistry Research, 2024; 5: 9-16.
[12] Mani A, Ramasamy P, Antony Muthu Prabhu A, Senthilraja P, Rajendiran N, Synthesis and Analysis of Ag/Olanzapine /Cyclodextrin and Ag/Co/Olanzapine /Cyclodextrin Inclusion Complex Nanorods. Physics and Chemistry of Liquids, 2024; 62: 196-209.
[13] Mani A, Ramasamy P, Antony Muthu Prabhu A, Senthilraja P, and Rajendiran N, Synthesis and Characterisation of Ag/Co/Chloroquine/Cyclodextrin Inclusion Complex Nanomaterials. J Sol-Gel Science and Technology, 2025.
[14] Ramasamy P, Mani A, Sneha B, Nivetha E, Venkatesan M, Rajendiran N, Azo-hydrazo tautomerism in Sudan Red-B and Cyclodextrin/Sudan Red-B doped ZnO nanomaterials. J Molecular Structure, 2025; 1329: 141423-32.
[15] Suchea M, Christoulakis S, Moschovis K, Katsarakis N, Kiriakidis G. ZnO transparent thin films for gas sensor applications. Thin Solid Films. 2006; 515: 551–554,
[16] Ashour A, Kaid MA, El-Syed NZ, Ibrahim AA. Physical properties of ZnO thin films deposited by spray pyrolysis technique. Appl. Surf. Sci. 2006; 252: 7844–7848,
[17] Chen JC, Tang CT. Preparation and application of granular ZnO/Al2O3 catalyst for the removal of hazardous trichloroethylene. J. Hazard. Mater. 2007; 142: 88–96,
[18] Mishra PK, Mishra H, Ekielski A, Talegaonkar S, Vaidya B, Zinc oxide nanoparticles: a promising nanomaterial for biomedical applications, Drug Discovery Today, 2017; 22: 1825–1834.
[19] Smijs TG, Pavel S, Titanium dioxide and zinc oxide nanoparticles in sunscreens: focus on their safety and effectiveness, Nanotechnology, Science and Applications, 2011; 4: 95–112.
[20] Ruszkiewicz JA, Pinkas A, Ferrer B, Peres TV, Tsatsakis A, Aschner M, Neurotoxic effect of active ingredients in sunscreen products, a contemporary review, Toxicology Reports, 2017; 4: 245–259.
[21] Kolodziejczak-Radzimska A, Jesionowski T, Zinc oxide–from synthesis to application: a review, Materials, 2014; 7: 2833–2881.
[22] S. Sahoo, M. Maiti, A. Ganguly, J. J. George, and A. K. Bhowmick, E8ect of zinc oxide nanoparticles as cure activator on the properties of natural rubber and nitrile rubber, Journal of Applied Polymer Science, 2007; 105: 2407–2415.
[23] Newman MD, Stotland M, Ellis JI, The safety of nanosized particles in titanium dioxide- and zinc oxide based sunscreens, J American Academy of Dermatology, 2009; 61: 685–692.
[24] Hatamie A, Khan A, Golabi M, Zinc oxide nanostructure-modi6ed textile and its application to biosensing, photocatalysis, and as antibacterial material, Langmuir, 2015; 31(39): 10913–10921.
[25] Xiao FX, Hung SF, Tao HB, Miao J, Yang HB, Liu B, Spatially branched hierarchical ZnO nanorod-TiO2 nanotube array heterostructures for versatile photocatalytic and photo electrocatalytic applications: towards intimate integration of 1D-1D hybrid nanostructures, Nanoscale, 2014; 6: 14950–14961.
[26] Siva Kumar Surabhi, Venkateswarlu Rao Putcha, Vanka Ranga Rao, Gollapalli Nageswara, Synthesis, characterization and optical properties of zinc oxide nanoparticles, International Nano Letters, 2013; 3: 30.
[27] Noorian SA, Hemmatinejad N, Navarro J A, Ligand modified cellulose fabrics as support of zinc oxide nanoparticles for UV protection and antimicrobial activities. International J biological macromolecules, 2020; 154: 1215-1226.
[28] Rajendiran N. Sankaranarayanan R. K. Saravanan J. Nanochain and vesicles formed by inclusion complexation of 4, 4’-diaminobenzanilide with Cyclodextrins. J. Experimental Nanoscience, 2015; 10: 880-899.
[29] Jude Jenita M. Venkatesh G. Subramanian VK. Rajendiran N, Twisted Intramolecular Charge Transfer effects on fast violet B and fast blue RR: Effect of HP-α-CD and HP-β-CDs. J. Molecular Liquids, 2013; 178: 160-167.
[30] Rajendiran N. Sankaranarayanan R. K. Saravanan J. Nanostructures formed by cyclodextrin covered amino benzophenones through supramolecular self-assembly, Spectrochim Acta, 2014; 127A: 52-60.
[31] Antony Muthu Prabhu A. Rajendiran N. Encapsulation of labetalol, and pseudoephedrine in β-CD cavity: Spectral and molecular modeling studies. J. Fluorescence, 2012; 22: 1461-1474.
[32] Anton Smith A. Kannan K. Manavalan R. Rajendiran N. Intramolecular charge transfer effects on flutamide drug. J. Fluorescence, 2010; 20: 809–820,
[33] Rajendiran N, Mohandoss T, Sankaranarayanan RK, Nanostructures formed by cyclodextrin covered procainamide through supramolecular self assembly–Spectral and molecular modeling study. Spectrochim Acta A, 2015; 136: 875-883.
[34] Rajendiran N, Venkatesh G, Sankaranarayanan RK, Dual fluorescence of omeprazole: Effect of solvents and pH. Physics and Chemistry of Liquids, 2014; 52: 738-750.
[35] Venkatesh G, Saravanan J, Rajendiran N, Cyclodextrin covered organic micro rod and micro sheet derived from supramolecular self-assembly of 2,4-dihydroxyazobenzene and 4-hydroxyazobenzene inclusion complexes. Bull Chem Soc of Japan, 2014; 87: 283-293.
[36] Nag A, Dutta R, Chattopadhyay N, Bhattacharyya K, Effect of cyclodextrine cavity size on twisted intramolecular charge transfer emission: Dimethylamino benzonitrile in β-cyclodextrine. Chem. Phys. Lett. 1989; 157: 83-86.
[37] Nag A, Bhattacharyya K, Twisted intramolecular charge transfer emission of dimethylamino benzonitrile in α-cyclodextrin cavities. Chem. Phys. Lett. 1988; 151: 474-476.
[38] Dodiuk H, Kosower EM, Multiple fluorescence from the excited state of N-methyl-2-N-phenyl-amino-6-naphthalenesulphonate in glycerol: Fast proton transfer. Chem. Phys. Lett. 1975; 34: 253-257.
[39] Kosower E. M. Dodiuk H, Multiple fluorescences. II. A new scheme for 4-(N, N-dimethylamino) benzonitrile including proton transfer. J. Am. Chem. Soc. 1976; 98, 924-929.
[40] Khalil OS, Hofeldt RH, McGlynn SP, Electronic Spectroscopy of Highly-Polar Aromatics. Molecular interactions in the ground and excited states of N, N-Dimethyl-p-cyanoanline. Chem. Phys. Lett. 1972; 19: 479-482.
[41] Khalil OS, Hofeldt RH, McGlynn SP, Electronic spectroscopy of highly-polar aromatics. V. The polar excimer of N, N-dialkyl-p-cyanoaniline. J. Lumin. 1973; 6: 229-244.
[42] Khalil OS, Meeks JL, McGlyn SP, Electronic states and “Geometric Isomerism” of p-disubstituted cyanoanilines. Chem. Phys. Lett. 1976; 39: 457-461.
[43] Cho DW, Kim YH, Kang SG, Yoon M, Kim D, Cyclodextrin effects on excited-state geometry change and intramolecular charge transfer of 4-biphenylcarboxylic acid. J. Phys. Chem. 1994; 98: 558-562.
[44] Cho DW, Kim Y, Kang SG, Yoon M, Kim D, Cyclodextrin effects on intramolecular charge transfer of 2-biphenylcarboxylic acid: a pre-twisted molecule. J. Chem. Soc., Faraday Trans. 1996; 92: 29-33.
[45] Allwyn Jeyadurai J Muthuselvan P. Antony Muthu Prabhu A. Rajendiran N. Arish Dasan, Formation of Inclusion Complexes of 2-Hydroxypropyl β-Cyclodextrin with 2-Hydroxychalcone: Experimental and Theoretical Study. Polycyclic Aromatic Compounds, 2024; 44: 5038-5059,
[46] Antony Muthu Prabhu, A. Suresh Kumar GS. Rajendiran N. Sathiyaseelan K. Balamathi M. Interactions between Diphenylamine with 2-Hydroxypropyl β-Cyclodextrin based on Spectral, Biological and Theoretical Investigations. J Macromolecular Science, Part B, 2024; 63: 536-569,
[47] Rajendiran N. Antony Muthu Prabhu A. Mohandoss T. Thulasidhasan J. Baskaran R. Spectral and theoretical investigation of inclusion complex between cinnamic acid and hydroxycinnamic acids with native cyclodextrins. Polycyclic Aromatic Compounds, 2022; 42: 3563-3585,
[48] Sankaranarayanan RK. Venkatesh G. Jayashree Ethiraj. Pattabiraman., M. Saravanakumar K. Arivazhagan G. Shanmugam R. Rajendiran N. Stepwise pesudopolyrotaxane nanostructure formation from supramolecular self-assembly by inclusion complexation of fast violet B with α- and β-cyclodextrins. J. Molecular Structure, 2022; 1262: 133080-89,
[49] Sukesh Kashiram Tumram, Rajdip Bandyopadhyaya, Zinc oxide nanostructures: Experiments probing their transformation to nanorods. Materials Science and Engineering: B, 2023; 296: 116569.
Cite This Article
  • APA Style

    Ramasamy, P., Mani, A., Sneha, B., Nivetha, E., Prabhu, A. A. M., et al. (2025). Synthesis and Characterisation of Methyl Violet/Cyclodextrin Doped ZnO Nanocrystals. Colloid and Surface Science, 7(1), 19-30. https://doi.org/10.11648/j.css.20250701.12

    Copy | Download

    ACS Style

    Ramasamy, P.; Mani, A.; Sneha, B.; Nivetha, E.; Prabhu, A. A. M., et al. Synthesis and Characterisation of Methyl Violet/Cyclodextrin Doped ZnO Nanocrystals. Colloid Surf. Sci. 2025, 7(1), 19-30. doi: 10.11648/j.css.20250701.12

    Copy | Download

    AMA Style

    Ramasamy P, Mani A, Sneha B, Nivetha E, Prabhu AAM, et al. Synthesis and Characterisation of Methyl Violet/Cyclodextrin Doped ZnO Nanocrystals. Colloid Surf Sci. 2025;7(1):19-30. doi: 10.11648/j.css.20250701.12

    Copy | Download

  • @article{10.11648/j.css.20250701.12,
      author = {Palanichamy Ramasamy and Ayyadurai Mani and Balakrishnan Sneha and Ezhil Nivetha and Albert Antony Muthu Prabhu and Govindaraj Venkatesh and Poomalai Senthilraja and Narayanasamy Rajendiran},
      title = {Synthesis and Characterisation of Methyl Violet/Cyclodextrin Doped ZnO Nanocrystals
    },
      journal = {Colloid and Surface Science},
      volume = {7},
      number = {1},
      pages = {19-30},
      doi = {10.11648/j.css.20250701.12},
      url = {https://doi.org/10.11648/j.css.20250701.12},
      eprint = {https://article.sciencepublishinggroup.com/pdf/10.11648.j.css.20250701.12},
      abstract = {Methyl violet/ cyclodextrin doped on ZnO nanocrystals were synthesized and characterized by various spectral and microscopic methods. The effect of different polarity of the solvents, α-cyclodextrin (α-CD) and β-cyclodextrin (β-CD) on MV were studied by various spectral methods. The inclusion behaviour of MV on both CDs were determined by PM3 method. Doping effect of MV/CD on ZnO nano investigated by UV-visible, fluorescence, FTIR, DTA, XRD, FE-SEM and TEM methods. MV molecule exhibits dual emission in all the solvents, α-CD and β-CD while three absorption maxima noticed in the ground state. The normal Stokes shifted band was originated from the locally excited state and the large Stokes shifted band was due to the emission from a twisted intramolecular charge transfer (TICT) state. Presence of isosbestic point suggest 1:1 inclusion complex is formed. HOMO-LUMO gap for MV/β-CD inclusion complex was more negative, which support that this complex is more stable than MV/α-CD inclusion complex. A red or blue shifted absorption and fluorescence maximum was seen in β-CD/MV/ZnO nanocrystals than MV/CD. Nanoparticle size was measured by TEM-EDS and X-RD methods. TEM image showed nanocrystals are formed in ZnO/MV/β-CD.
    },
     year = {2025}
    }
    

    Copy | Download

  • TY  - JOUR
    T1  - Synthesis and Characterisation of Methyl Violet/Cyclodextrin Doped ZnO Nanocrystals
    
    AU  - Palanichamy Ramasamy
    AU  - Ayyadurai Mani
    AU  - Balakrishnan Sneha
    AU  - Ezhil Nivetha
    AU  - Albert Antony Muthu Prabhu
    AU  - Govindaraj Venkatesh
    AU  - Poomalai Senthilraja
    AU  - Narayanasamy Rajendiran
    Y1  - 2025/06/20
    PY  - 2025
    N1  - https://doi.org/10.11648/j.css.20250701.12
    DO  - 10.11648/j.css.20250701.12
    T2  - Colloid and Surface Science
    JF  - Colloid and Surface Science
    JO  - Colloid and Surface Science
    SP  - 19
    EP  - 30
    PB  - Science Publishing Group
    SN  - 2578-9236
    UR  - https://doi.org/10.11648/j.css.20250701.12
    AB  - Methyl violet/ cyclodextrin doped on ZnO nanocrystals were synthesized and characterized by various spectral and microscopic methods. The effect of different polarity of the solvents, α-cyclodextrin (α-CD) and β-cyclodextrin (β-CD) on MV were studied by various spectral methods. The inclusion behaviour of MV on both CDs were determined by PM3 method. Doping effect of MV/CD on ZnO nano investigated by UV-visible, fluorescence, FTIR, DTA, XRD, FE-SEM and TEM methods. MV molecule exhibits dual emission in all the solvents, α-CD and β-CD while three absorption maxima noticed in the ground state. The normal Stokes shifted band was originated from the locally excited state and the large Stokes shifted band was due to the emission from a twisted intramolecular charge transfer (TICT) state. Presence of isosbestic point suggest 1:1 inclusion complex is formed. HOMO-LUMO gap for MV/β-CD inclusion complex was more negative, which support that this complex is more stable than MV/α-CD inclusion complex. A red or blue shifted absorption and fluorescence maximum was seen in β-CD/MV/ZnO nanocrystals than MV/CD. Nanoparticle size was measured by TEM-EDS and X-RD methods. TEM image showed nanocrystals are formed in ZnO/MV/β-CD.
    
    VL  - 7
    IS  - 1
    ER  - 

    Copy | Download

Author Information
  • Abstract
  • Keywords
  • Document Sections

    1. 1. Introduction
    2. 2. Experimental
    3. 3. Result and Discussion
    4. 4. Conclusion
    Show Full Outline
  • Abbreviations
  • Acknowledgments
  • Author Contributions
  • Data Availability Statement
  • Conflicts of Interest
  • References
  • Cite This Article
  • Author Information