1. Introduction
The Shroud of Turin consists of linen cloth approximately 14.25 ft long by 3.58 ft wide, and it is one of the most studied relics in history. There is a vast literature on the scientific analysis of the image on the Shroud. The Shroud has a very faint image of a crucified man on it, and at present there is no acceptable scientific explanation about how this image was formed
| [1] | McAvoy T. God the Geometer. How Science Supports Faith. Wipf and Stock: Eugene, OR, USA; 2024, p. 107. |
[1]
. Many researchers who have studied the cloth have postulated that some type of radiation was involved in the image formation. Many people believe the image on the Shroud is that of Christ. This paper analyzes what artificial intelligence can determine from information in images of the Shroud and their possible cause.
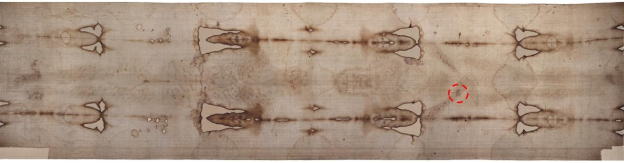
Figure 1 shows a copy of a photo of the Shroud taken by Durante in 2002
.
The Shroud contains both a dorsal (back) and a frontal (front) image. The triangular holes show where the Shroud was originally patched after a 1532 fire damaged the cloth. Two of the corners of the Shroud are also missing. In addition to the image there are many blood marks on the Shroud, one of which on the right wrist is illustrated with the small circle in
Figure 1. There are also a few stains from the water that was used to extinguish the 1532 fire, as well as an earlier undocumented incident.
Figure 1. Durante Photo of the Shroud of Turin.
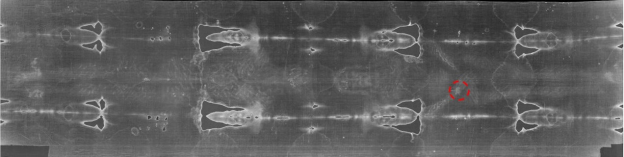
The Shroud has a number of very interesting properties associated with its image. The image is very superficial and only a few micrometers deep. One of the most interesting features of the image is that it appears to be very similar to a photographic negative image. Secondo Pia took the first photograph of the Shroud of Turin in 1898
. When he examined the negative of his photo, he was amazed at its detail compared to the Shroud itself. A negative of the Shroud image in
Figure 1 is shown in
Figure 2.
This negative was calculated by converting Durante’s image to the CIELab color space, where the L dimension gives image intensity, and a and b are color dimensions
. Next the color a and b dimensions were set to 0 and the pixels in the resulting image were inverted by first determining the maximum value of the L pixels, Lmax. Then each pixel’s intensity value, L, was replaced with Lmax minus L.
Figure 2 was made by converting the resulting CIELab image back to an RGB image and then using the Matlab imshow.m function to display it. Thus,
Figure 2. contains a negative of the image intensity of Durante’s image in
Figure 1. Note that Pio’s image being a photographic negative also had the order of its rows reversed with the result that items are shifted from top to bottom in Pio’s image. For example, in Pio’s negative image the wrist wound circled in
Figure 1 is on the left arm.
Figure 2 contains the same intensity information that Pio’s negative image contains. Further the intensity in
Figure 2 has an almost perfect correlation to the intensity of Durante’s Shroud image.
The Shroud of Turin image appears like a photographic negative because the light and dark areas are reversed. Where the body should be darkest on a normal image, it appears lightest on the Shroud, and vice versa. However, there is one important exception to this effect on the Shroud image. The blood marks on the original image are positive, i.e. they are dark on the Shroud and light on the negative as indicated by the two circles on the figures. Researchers have interpreted this exception to mean that the blood was transferred to the Shroud prior to image formation
| [5] | Lavoie, G., The Shroud of Jesus: And the Sign John Ingeniously Concealed, Sophia Institute Press: Manchester, NH, USA; 2023, p. 15. |
[5]
. Examination of the Shroud under the blood marks shows that there is no image there.
Multivariate statistical methods have been used effectively for machine learning. These methods can be used to develop models from data, as well as to evaluate the performance and accuracy of the model. The multivariate methods include among others classification, clustering, dimensionality reduction, and feature selection. In this paper principal component analysis (PCA) is used to analyze images of the Shroud in order to determine what information they contain that may be helpful in identifying how the image was formed. In addition, image differentiation is applied to the negative image shown in
Figure 2 to illustrate how information in the Shroud can produce the appearance of three-dimensional properties of the cloth. The methods discussed may be useful for analyzing other historical images as well.
The organization of this paper is as follows. After the Introduction, the dimensionality reduction method principal component analysis (PCA) is briefly explained, and applied to the Shroud. It is demonstrated that the Shroud’s image intensity captures essentially all the important information in the image. Next signal processing is used to demonstrate that a gradient in Shroud’s image intensity is the underlying reason for its apparent three-dimensional properties. PCA has been applied to ultraviolet induced fluorescence images of the Shroud, and these results are reviewed. In the case of the ultraviolet Shroud images, image intensity is also the key variable that captures the information in these images
. Analysis of the fluorescence images shows that the molecular properties of the Shroud vary with location on the cloth. Finally, recommendations and conclusions are given.
2. Principal Component Analysis of the Shroud Image
The dimensionality reduction method, principal component analysis (PCA) was originally published by Hotelling
| [7] | Hotelling, H. Analysis of a complex of statistical variables into principal components. J. Educ. Psychol. 1933, 24, pp. 417–441, and pp, 498–520. |
[7]
. Although PCA is an old method it is still used today in artificial intelligence applications. A more recent nonlinear extension of PCA using principal curves and artificial neural networks has also been published by the author
. PCA allows one to summarize the information content in a database with a smaller set of more easily visualized variables. Let X be an nxp data matrix where each column is a different measurement and each row is a different measured data point. To use PCA, the raw data are scaled to zero mean and unit variance for each independent variable, giving a scaled data matrix Y. PCA is related to matrix singular value decomposition of Y=U
A
T, where A is an orthonormal matrix of the right singular vectors of Y, U is an orthonormal matrix of the left singular vectors of Y, and
is a diagonal matrix of the singular values of Y
. The principal components of Y are given by the columns of U
, which are equal to YA because of the orthonormal property of A. The matrix YA shows that principal components are linear combinations of the raw variables in Y. The columns of the matrix A are called the PC loadings and the columns of the matrix U
give the scores for each PC. The first column of YA, PC1, explains the maximum variance of Y that a linear combination of the raw variables can explain. The remaining columns of YA in order, explain a decreasing amount of the variance in the raw data. PC2 explains less variance than PC1, and PC3 less than PC2 and so on. Since the PCs explain the variance in a data set, they capture the information content in the data set.
The Shroud image in
Figure 1 is an RGB image and as such it has 3 independent variables, the values of its R, G, and B pixels. This image has a dimension of 1430x364, and its X matrix has a size of 520520x3. When PCA is applied to this matrix PC1 explains 98.4% of the variance, and therefore the information in the X matrix.
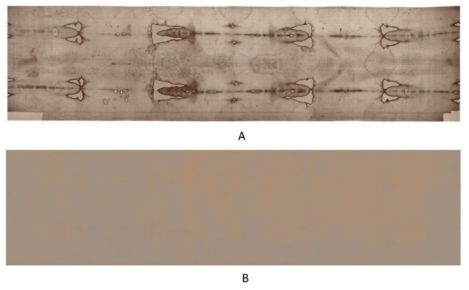
Figure 3 A shows the re-creation of Durante’s image using only of PC1.
Figure 3. PCA reconstruction of Durante’s image.
Figure 3 B shows the re-creation of Durante’s image if PC2 and PC3 are used together. The sum of the images re-created from PC1, PC2, and PC3 gives the original image. Since the Durante image only has three PC components,
Figure 3 B gives the difference between the original image and the image recreated from PC1.
Figure 3 demonstrates that the vast majority (98.4%) of the information in Durante’s photo is captured by PC1. McAvoy gives an example of a photo where all three PC’s contribute to the image and it cannot be accurately reproduced using only PC1
.
Now consider the negative Shroud image shown in
Figure 2. Calculating the correlation coefficient between the PC1 scores from Durante’s image, the first column of U
, and the intensity of the pixels of the negative image, Lmax-L, shown in
Figure 2, gives a correlation coefficient of -.9984. If L were correlated with U
then the correlation coefficient would be +.9984. The correlation coefficient for
Figure 2 indicates that the negative image is almost perfectly inversely correlated with PC1. The image in
Figure 2 contains essentially the same information as PC1 for Durante’s image in
Figure 1, namely 98.4% of the information. Application of PCA to Durante’s Shroud image highlights the fact that its image intensity contains the most significant information about the image. In addition to being able to reconstruct the Shroud image from its intensity, this intensity has another interesting property which is discussed next.
3. Three-Dimensional Property of the Shroud
The three-dimensional property of the Shroud image was discovered by John Jackson and Eric Jumper in 1976. They visited William Mottern at Sandia Scientific Laboratories on Feb. 19 and discussed a new piece of equipment there, a VP-8 Image Analyzer. Also in 1976, Peter Schumacher, a product engineer who worked on the VP-8 Analyzer, installed one in the home of Eric Jumper. The analyzer was developed as a spin-off of NASA’s space research. The analyzer translated changes in image light and dark pixels, i.e. image intensity, into relief so that heights of mountains such as those on the Moon could be visualized. The analyzer works on differences in pixel intensity, and as such it acts like it is differentiating the image. Effectively the VP-8 Analyzer provided a three-dimensional plot based on image intensity changes. When the VP-8 Analyzer was applied to a negative image of the Shroud, it produced a “three-dimensional image which could be consistently rotated without distortion”
| [10] | Wilson, I. The Mysterious Shroud. Doubleday, New York, USA. 1986, p. 49. |
[10]
.
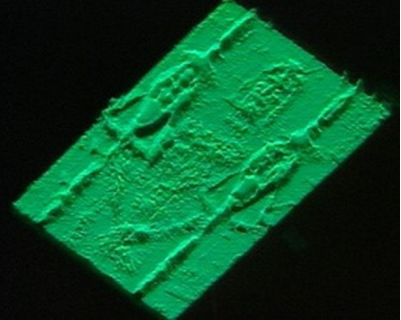
Figure 4 shows a VP-8 Shroud image
.
If the VP-8 Analyzer is used on typical grayscale images, they can show distortion. Peter Schumacher has a website
where he illustrates both the distortion of typical VP-8 images (photos 5-8 on the site) as well as a YouTube movie illustrating the lack of distortion of the Shroud’s VP-8 image when the Analyzer is rotated.
As a result of the interesting three-dimensional information contained in the Shroud image, Jackson, Mottern, and Jumper formed the Shroud of Turin Research Project (STURP) in 1977 to further study the cloth. A 32-member scientific STURP team travelled to Turin Italy in 1978 and they carried out numerous experiments. The experiments included x-ray transmission and fluorescence detection, microscopy, photoelectric spectrophotometry, infrared and UV spectrometry, and black and white/color/UV photography
| [13] | Jumper, E., Mottern, R. Scientific Investigation of the Shroud. Applied Optics. 1980 19, pp. 1909-19121980. |
[13]
.
In 1982 Jackson and STURP co-workers published the following conclusions from STURP’s analysis of the three-dimensional characteristics of the Shroud
:
1) “The frontal image on the Shroud has a shading structure consistent with a body shape covered with a naturally draping cloth and which can be derived from a single, global mapping function relating image shading with distance between these two surfaces”.
2) “The visible image on the Shroud is not the work of an artist”.
In 1984 Jackson and STURP co-workers discussed the correlation of image intensity on the Turin Shroud with the 3-D structure of a human body shape
| [15] | Jackson, J., et al. Correlation of image intensity on the Turin Shroud with the 3-D structure of a human body shape. Applied Optics. 1984, 23, pp. 2244-2270. https://doi.org/10.1364/AO.23.002244 |
[15]
. They reaffirmed conclusions 1 and 2 and they added a third conclusion.
3) “A complex mechanism involving more than one process may account for some of the Shroud image's characteristics, but potential inconsistencies in shading continuity, cloth contact, lateral distortions, and pressure independence may exist. We have examined a variety of image formation hypotheses in a generic sense and found that, while each explains some subset of all known observational characteristics of the Shroud image, no single hypothesis seems to simultaneously explain them all. The shading structure of the Shroud image, which has a 3-D correlation with a human body shape, good resolution, and resides on the cloth surface, has not been adequately explained”.
Even today, all three conclusions are valid, especially the third conclusion. Since 1984 many researchers have proposed mechanisms for how the Shroud’s image was formed. The most widely accepted hypotheses involve a short-lived burst of radiation such as UV radiation
, or corona discharge
. The complexity of the problem is illustrated by a recent paper by Fanti who lists 24 features of the image on the Shroud that need to be scientifically explained for any valid image formation hypothesis
| [18] | Fanti., G. Holy fire and body image of the holy Shroud: Divine photography hypothesis. World Scientific News. 2023, 76, pp. 193-120. |
[18]
.
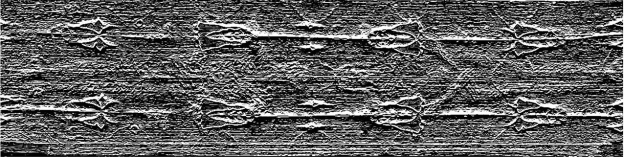
Not only is the negative image in
Figure 2 sharper than Durante’s image, but it also contains additional three-dimensional information. The VP-8 analyzer produces its three-dimensional images on a CRT display which employs raster scanning. CRT tubes do not scan vertically and horizontally simultaneously. When applied to the Shroud the VP-8 analyzer would scan vertically first (the short dimension in Figures 1 and 2), creating a series of lines, and then moving its electron beam horizontally down the screen to create the full image. The MATLAB routine imgradientxy.m. can be used to calculate a discrete approximation to ∂I/∂y for this image in
Figure 2, where I is the intensity of each pixel (Lmax-L) and y is the short vertical direction. This approximation would be comparable to how the VP-8 analyzer worked when it was used to photograph the Shroud. This calculation was made using the Sobel method to approximate partial derivatives. The gradient of a pixel is a weighted sum of pixels in the 3-by-3 neighborhood. For gradients in the vertical (
y) direction, the Sobel weights are: [1 2 1; 0 0 0; -1 -2 -1]. For better visualization ∂I/∂y was increased by a factor of 10. Note that the VP-8 analyzer also uses a gain adjustment to visualize images. The result of the numerical differentiation is shown in
Figure 5.
To make
Figure 5 the gradient matrix, ∂I/∂y, was combined with zero a and b color CIELab matrices. Then the resulting CIELab image was converted back to an RGB image and the Matlab imshow.m function was used to display it. As can be seen, differentiation of the Shroud negative intensity image produces an image that appears to have three-dimensional properties. This three-dimensional property is encoded in the Shroud’s image intensity. Thus, not only does the negative Shroud image in
Figure 2 act like a photographic positive, but it also contains the same three-dimensional information that was photographed by the VP-8 analyzer.
4. Principal Component Analysis of UV Induced Fluorescence Images of the Shroud
Absorption of UV radiation by linen causes electrons in the linen to be raised to a higher energy state. After the electrons settle back, energy is emitted in the visible light range and this process is referred to as UV induced fluorescence.
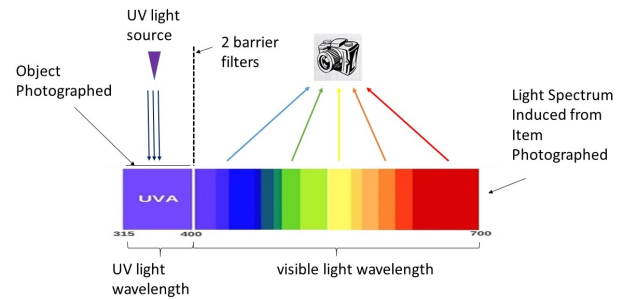
Figure 6 shows the setup used for UVIF photography.
Figure 6. UVIF photography setup.
A UV source shines light onto the object photographed, and two barrier filters are used, one for the UV source and one for the camera. The UV source filter stops visible light from the source being emitted and photographed by the camera. The camera filter stops reflected UV light from the object studied being photographed by the camera. Thus, the only light photographed is the re-emitted visible light.
Vernon Miller was the official scientific photographer for the STURP project. Unfortunately, Miller’s original UV induced fluorescence (UVIF) Shroud images have been lost. In April 2019, 44 high-quality UVIF Shroud images, reproduced from transparencies made by Miller, were published on the web
. In making the transparencies Miller used color correction yellow and magenta filters, and McAvoy was able to correct these web images back toward the color of the original images
. The UVIF images on the web have been examined in several papers
| [6] | McAvoy, T. Information in the Shroud of Turin about its variable molecular properties. Int. J. Archaeology. 2024, 12, pp. 58-67. https://doi.org/10.11648/j.ija.20241202.15 |
| [20] | McAvoy, T. Shroud of Turin ultraviolet light images: color and information content. Applied Optics. 2021, 60, pp. 6604-6613. https://doi.org/10.1364/AO.422447 |
| [21] | McAvoy, T. Analysis of UV photographs of the Shroud of Turin. Applied Optics. 2019, 58, pp. 6958-6965. https://doi.org/10.1364/AO.58.006958 |
| [22] | McAvoy, T. On radiocarbon dating of the Shroud of Turin. Int. J. Archaeology. 2021, 9, pp. 34-44. https://doi.org/10.11648/j.ija.20210902.11 |
[6, 20-22]
, and the results are briefly reviewed here since the corroborate the relationship between Shroud photo image intensity and its information content discussed above.
Molecular details in the Shroud, such as any molecular bonding differences, burn marks, and contamination, can cause differences in UVIF photos of the Shroud taken at different locations on the cloth. Thus, UVIF results can give information about the underlying molecular nature of the Shroud, i.e. whether its molecular properties are uniform or they vary. If UVIF results differ with location, then this information is relative in the sense that it simply indicates whether one location of the Shroud differs from another. The information does not necessarily indicate what the specific molecular differences are, such as molecular bond differences or contamination differences. Additional information, e.g. from chemistry, is needed to make such distinctions. This situation is similar to the VP-8 analyzer and image differentiation supplementing the intensity PCA result for Durante’s photo.
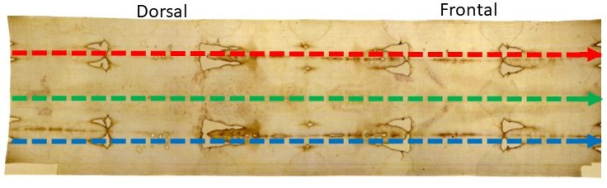
The Shroud is large enough that Miller could not take a single UVIF photo of it. Rather, Miller used a rail system to move the camera down the Shroud
| [23] | Miller, V., Pellicori, S. Ultraviolet fluorescence photography of the Shroud of Turin. J. Biol. Photography. 1981, 49, pp. 71–85. |
[23]
, stopping at various locations along the cloth and taking UVIF photos. UVIF photos were taken of both the frontal and dorsal images. The rail system Miller used had an arm that kept camera at the same distance from the Shroud for each image. Miller took UVIF photos along the top (red path), center (green path), and bottom (blue path) sections of the Shroud, as shown in
Figure 7.
Figure 7. Paths for UVIF Shroud photos.
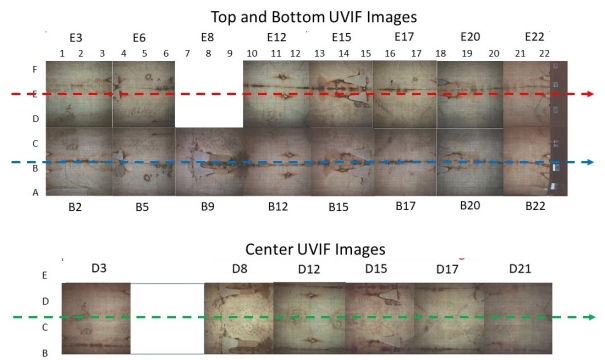
Note that the center path overlaps by about ½ the top and bottom paths respectively. The 21 UVIF images published on the web and analyzed by McAvoy
are shown in
Figure 8.
The two missing images were detected as outliers, probably due to a misfiring of the power source for the UV lamp used. Unfortunately, the UV lighting system Miller used did not evenly illuminate the Shroud section being photographed. As a result, the only way to compare the fluorescence intensity of Miller’s UVIF images to one another is to compare the average UVIF intensity for each image
. A pointwise comparison of the images cannot be done without modeling the UV lighting source. Using PCA McAvoy found that, similar to Durante’s visible light image, over 96% of the variation in all 21 of the UVIF images could be explained by their first principal component, PC1
. Thus, PC1 explains the vast majority of information in both the Durante image and the UVIF images. McAvoy calculated the average UVIF intensity for the 21 UVIF images shown in
Figure 8. In doing so he converted the UVIF images to the CIE Lab color space
, where the L dimension gives image intensity. It was also shown that UVIF image intensity correlated very closely with the UVIF PC1 scores.
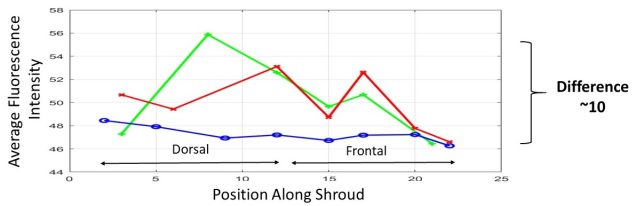
Figure 9 below shows these average UVIF intensity results.
As the results in
Figure 9 show, there is roughly an 18% difference in UVIF image intensity depending on the Shroud location photographed. The top (red path) and bottom (blue path) results are particularly interesting since the images photographed for each have almost identical burn marks. The identical burn marks probably resulted from the way the cloth was folded when it was burned. As can be seen there is a significant difference between the UVIF intensity results for the top and bottom of the Shroud. The intensity of the top of the Shroud is always greater than that of the bottom. The maximum intensity, 56, occurs in the center (green path) dorsal image.
As part of the STURP research Gilbert and Gilbert measured fluorescence spectra at 16 locations on the Shroud
| [24] | Gilbert, R., Gilbert, M. Ultraviolet-visible reflectance and fluorescence spectra of the Shroud of Turin. Applied Optics. 1980, 19, pp. 1930-1936. https://doi.org/10.1364/AO.19.001930 |
[24]
. The measured points included 4 image points, 3 blood stain points, 5 burn marks, and 4 clear points. Similar to the UVIF images, the fluorescence spectra were induced by a UV source. The fluorescence spectra were determined for a very small region of the Shroud, unlike the UVIF images which covered a much larger region. A recent analysis of Gilbert and Gilbert’s results showed that the spectral fluorescence varied with position on the Shroud and the magnitude of the variation was similar to that shown in
Figure 9 . In particular, there was a significant variation in the spectral intensity results for the image and clear areas which were not seen to be contaminated with either blood or water stains. The spectral fluorescence results corroborate the spatial variation in UVIF intensity shown in
Figure 9.
As discussed above, such things as contamination, burn marks and differences in molecular bonding could cause differences in UVIF intensity. Since the red and blue curves result from images with almost identical burn marks, their difference in intensity would not be due to burn marks. Further it is doubtful that the Shroud was contaminated in such a way that the patterns shown in
Figure 9 would result only from contamination. Thus, one can conclude that it is likely that molecular bonding varies with position on the Shroud.
A question that needs to be answered is what was the cause of the variation in the UVIF intensity of the Shroud with location. Does this variation in UVIF intensity reflect a difference in molecular bonding? Several types of radiation have been shown experimentally to affect the fluorescence of linen. Di Lazzarro et al
presented results for the effect of deep ultraviolet radiation on linen fluorescence. Fanti presented results that showed that a corona discharge can affect linen fluorescence
. McAvoy had linen irradiated in a neutron reactor and showed that the radiation from the reactor affected the linen fluorescence
. In addition to neutron radiation, McAvoy’s reactor also exposed the linen to gamma radiation. Fanti also measured beta-radiation from a blood sample taken from the Shroud
| [25] | Fanti G. New Insights on Blood Evidence from the Turin Shroud Consistent with Jesus Christ’s Tortures. Arch Hematol Case Rep Rev. 2024; 9(1): 001-015. https://doi.org//10.17352/ahcrr.000044 |
[25]
. He concluded that the beta-activity from the sample was several orders of magnitude larger than that of the support glass for the sample. Thus, several types of radiation are potential sources of the variation in UVIF intensity of the Shroud with position. An unanswered question is whether there are other potential and possible non-radiation sources.