2. Theoretical Review
2.1. Legitimacy Theory
The propounder of the legitimacy theory is Suchman who started it in 1995 and claimed that the existence of an entity is pegged on its value that is perceived to match with that of the larger society in which it undertakes its operations. According to Suchman, as supported by Linthicum
et al.
| [27] | Linthicum, C., Reitenga A., L. & Sanchez, J., M. (2010). Social responsibility and corporate reputation: The case of Arthur Andersen audit failure. Journal of Accounting & Public Policy, 29(2), 160-176. https://doi.org/10.1016/j.jaccpubpol.2009.10.007 |
[27]
legitimacy theory postulates that an organization’s operations thrive within a system that is socially constructed, defined by norms and values meant to maintain organizational legitimacy.
The theory assumes a social concurrence between the entity and society that it ought to report to, as the organization exerts influence on the society in which it operates and the organization gets influenced socially by the society. Thus, the organizational legitimacy concept, grants an organization the opportunity to undertake its operations in a contract with the interests of the society. Corporations therefore, pursue to function within the aspirations and norms of the respective communities where they are domiciled. The reasoning behind the legitimacy theory is that companies survival is dependent upon them operating within the framework of the society's norms and values
| [8] | Deegan, C. (2014). Financial Accounting Theory, (4th ed.). Sydney, NSW: McGraw Hill. |
[8]
. The theory then explains the decision taken by firms to effectively disclose non- financial information so as to gain legitimacy
| [7] | Dube, S., & Maroun, W. (2017). Corporate social responsibility reporting by South African mining companies: evidence of legitimacy theory. South African Journal of Business Management, 48 (1), 23-34. https://doi.org/10.4102/sajbm.v48i1.17 |
[7]
. Accordingly, Greiling and Grub
on this aspect opine that organizations must be accountable for their actions. The theory's criticism lies on the assumption that organizations perceive the legitimacy status to be under a threat. For this reason, whatever that is disclosed in annual reports and financial statements is all about the perception of the management other than being accountable to the stakeholders and is meant to advance their self-interest or purposefully for survival
| [8] | Deegan, C. (2014). Financial Accounting Theory, (4th ed.). Sydney, NSW: McGraw Hill. |
[8]
.
The relevance of this theory in this study is on the premise that the annual report has been spotted as a salient source of legitimization. This theory therefore, makes the foundation for fifth, sixth and seventh objectives to inform on social and relationship capital and environmental capital disclosure respectively, since the concept of legitimacy as discussed emphasize the provision of an explanation of the disclosures with regard to the social and environmental behavior of organizations.
2.2. Empirical Review
Kalunda
| [26] | Kalunda, E. N. (2012). Corporate social reports of firms listed in the Nairobi securities exchange, Kenya. European Journal of Business & Management, 4(8). |
[26]
conducted an exploratory study on social reports of corporations quoted on Nairobi securities exchange, Kenya. Respectively, the article was set to establish the form of social reports exhibited by Kenyan listed firms, the extent of social reporting, any availability of guidelines that the listed firms follow when preparing and presenting social reports and ensuring quality of such reports. Using exploratory research design, the study targeted a population of 42 listed firms. The final sample comprised of 21 firms from where primary and secondary data was compiled and analyzed by employing descriptive statistics. From the study there is an indication of availability of social reports though in small portions mentioned under the chairman's statement or directors statement or in the section on the annual report discussing corporate governance matters. Few companies prepared the social reports separately. There exist lack of full disclosure as the information presented in the social reports is incomplete and insufficient as it puts more emphasis on positive social activities while negative social impacts are ignored. No guidelines were found on the preparation of social reports and their presentation, therefore voluntary and based on the policy of the board in regard to environmental and social responsibilities. The social reports are not externally audited and attested, making their quality low.
Ngari
| [32] | Ngari, J. M. (2014). Relational capital and business performance of pharmaceutical firms in Kenya. International Journal of Science and Research (IJSR), 3(8). 1110-1115. |
[32]
study on pharmaceutical firms in Kenya inspected on how relational capital influenced performance of businesses. The paper specifically attempted to ascertain the extent of influence exerted by licensing and agreements, strategic alliances, customer and supplier relationships and knowledge of the customer on the performance of the business among the Kenyan pharmaceutical companies. Grounded on the resource-based view theory, the paper employed explanatory, quantitative and descriptive research designs and 89 pharmaceutical firms registered in the directory of manufacturers formed the research population. Using purposeful sampling 31 pharmaceutical firms licensed under the pharmacy and poisons board were identified for the accomplishment of this research. To accumulate primary data a structured questionnaire was put to use and data analysis accomplished by descriptive statistics and multiple regression approaches. Following the research findings, the aspects of strategic alliance, licensing and agreements, the relationship with customers and supplies and customer knowledge positively influenced performance of the business of pharmaceutical companies in Kenya. The study however was informed from only the pharmaceutical sector and only 3 aspects of relational capital were examined making the study results not generalizable to other sectors.
Gogan
et al.
| [15] | Gogan, M. L., Duran, D. C., & Draghici, A. (2014). Impact of relational capital on competitiveness of the organization. Network intelligence studies, 2(4), 233-240. |
[15]
studied on the effect of relational social capital reporting on competitiveness of the organization using a case of Romanian SME's. The research considered establishing the association of knowing stakeholders and organizational competitiveness of SME's, examining the impact of the relationship with stakeholders on organizational competitiveness and determining strategic collaboration’s effect on organizational competitiveness. Using case study viewpoint, 150 companies formed the study sample from which data was gathered by involving of a closed ended questionnaire. Multiple linear regression and Pearson correlation served as the main analytical methods for the purpose of testing the associations between the subcomponents of relational capital and organizational competitiveness. The study results witnessed a close relationship of relational capital and SME's competitiveness as a consequence of the subcomponents (knowing stakeholders, relationship with stakeholders and strategic collaboration) being positively associated with organizational competitiveness.
Munjuri
et al.
| [28] | Munjuri, K'Obonyo, & Ogutu (2015). Human capital, social capital and performance of commercial banks and insurance firms in Kenya. Prime Journal of Social Science (PJSS), 4(5), 1045-1057. |
[28]
studied on the aspects of human capital, social capital and performance of commercial banks and insurance companies in Kenya. The study was specifically set to evaluate the moderating and mediating object of social capital on the effect of human capital on performance of the firm. On the persuasion of human capital theory and social capital theory, the study put into use descriptive cross-sectional research design targeting a population of 88 companies comprising 45 insurance companies and 43 commercial that were all surveyed. Data was sourced from primary and secondary sources, with secondary data compiled from the financial statements of the organizations surveyed. The relationship hypothesized was evaluated using Baron and Kenny
| [2] | Baron, R. M., & Kenny, D. A. (1986). The moderator-mediator variable distinction in social psychological research: Conceptual, strategic and statistical considerations. Journal of Personality and Social Psychology, 51, 1173-1182. https://doi.org/10.1037/0022-3514.51.6.1173 |
[2]
approach and further, the data analyzed using descriptive statistics. From the study findings, the impact of human capital on firm performance is not significantly moderated by social capital. However, human capital effect on firm performance is mediated by social capital.
Haryono and Iskandar
| [16] | Haryono, U., & Iskandar, R. (2015). Corporate social performance and firm value. International Journal of Business & Management Invention, 4(11), 69-75. |
[16]
studied on corporate social capital reporting and firm value aiming at analyzing and explaining the association of social performance of a corporation and firm value. On the basis of the social contracting theory, stakeholder, legitimacy, and signaling theories, the study employed a survey design using a population of 44 companies from the mining sector quoted on the Indonesia stock exchange. Utilizing a sample of 14 companies purposefully selected from the stated population, secondary data was obtained from the annual reports of the selected firms and analyzed through structural equation models. The study observance indicate that corporate social performance impact on firm value insignificantly. Besides, the social performance of a corporation positively and significantly affected a corporation’s financial performance, with corporate financial performance positively and significantly affecting firm value. Further, corporate social performance had positively and significantly affected firm value through the corporate financial performance. The effect of a corporation’s social performance on firm risk was negative and significant, while, firm risk negatively and significantly influenced firm value. However, corporate social performance insignificantly impacted firm value through firm risk. The study’s weakness is on reliance of a small sample size limited to the mining industry comprising of 14 companies that may not support generalization of findings. Further, very few indicators of latent variables were noticed as either 1 or 2 indicators and this affected model fit as other suitable indicators might have been omitted.
Miocevic
interrogated the key exporter- importer relationships as part of relational capital and its antecedents. The article set to determine the impact of importer reliance and relational bonding norms on relational capital and whether formal or informal institutional distance moderate this relationship in Croatia. Anchoring the paper on institutional theory, the population consisted 655 active small and medium exporters extracted from a data set of the association exporters of Croatia. 122 exporters were selected from the manufacturing industry by use of a questionnaire that was analyzed by the application of structural equation modeling for confirmatory factor analysis, and ordinary least squares used for hypothesis testing. From the study findings importer reliance and relational bonding standard agreements were discovered to influence developments in relational capital and that institutional distance dimensions whether formal or informal show a significant moderating effect on relational norms leading to relational capital improvement. However, the study focused on SME's in Croatia, as such the interpretation of the results should be done cautionary because they may vary on the basis of industry and country context. Further, the study failed to account for the evolutionary nature of business relationships and the fact that to develop relational capital takes time calling for a longitudinal investigation.
Bhuyan
et al.| [5] | Bhuyan, M., Lodh, S. C. & Perera, N. (2017). The effects of corporate social disclosure on firm performance: Empirical evidence from Bangladesh. Accounting and Finance Association of Australia and New Zealand Conference, 1-36. https://ro.uow.edu.au/buspapers/1218 |
[5]
. empirically examined how the corporate social disclosure affect performance of the firm in Bangladeshian context. The paper objectively investigated the association of enterprise social disclosure and performance of the firm measured by asset returns, market capitalization and Tobin’s Q. On the foundation of legitimacy and signaling theories, the study considered a sample of top 200 companies quoted on the Dhaka stock exchange. Using data obtained from annual reports from the sampled companies covering the period 2011-2013, and putting into use content analysis and regression methods for data analysis. The aftereffect confirmed a significant relation between corporate social disclosure and firm performance. The weakness of the research is hinged on the fact that the social disclosure is confined within 30 items for performing content analysis and that the sample is limited to only 134 top firms in Dhaka stock exchange signaling inapplicability of the results to all firms.
Datta and De
| [10] | Datta, S. K., & De, T. (2017). Role of relational capital and firm performance: Analysis of a cluster of Bell-metal enterprises in a rural region in West Bengal, India. Journal of Entrepreneurship & Organization Management, 6, 204. https://doi.org/10.4172/2169-026X.1000204 |
[10]
article judged the purpose of relational capital on the performance of the firm by analyzing Bell-metal enterprises based in Nadia district West Bangal rural region in India. The paper specifically sought to address how the subcomponents of relational capital encompassing customer relations, input supplier relations, technological knowledge sharing, external groups bonding, informal relations with firms in the cluster, location, reputation, trust and good faith relationship and their association with firm performance. The target population comprised of companies in the bell-metal category operating in the area from which a sample of 60 firms was determined using cluster sampling. Primary data was gathered from the managers of the recognized firms by use of questionnaires that were pre-structured and the variables of interest analyzed using the principal component method and regression analysis. Overall, the study results uncovered a positive and significant bond between relational capital and the of competitive performance of the firms operating in the studied sector as evidenced through the positive relation with its subcomponents. However, due to the small sample and drawing data from one region the study findings may not be sufficiently interpreted to be representative for other regions and states as regional differences may yield different results.
Casonato
et al. | [6] | Casonato, F., Farneti, F., & Dumay, J. (2018). Social capital and integrated reporting: Losing legitimacy when reporting talk is not supported by actions. Journal of Intellectual Capital, 20(1), 144-164. https://doi.org/10.1108/JIC-08-2018-0132 |
[6]
. researched on social capital and integrated reporting in particular on how legitimacy is lost when reporting talk is unsupported by actions using a case of CBD bank in Australia. The research aimed at exploring the impact of integrated reporting on relational capital and its role on repairing organizational reputation. Precisely, the investigation sought to gauge if reported information in the integrated reports of firms consistently mirrored other information at the disposal of the investors from other media. Using a case study approach of the CBD bank that has been rocked by major scandals during the period 2004-2013, the study was based on impression management theory, ex-post facto analysis was used to investigate the consistency of information accommodated in CBD bank's integrated report with other publicly available information accessible by investors. It is established from the study that a gap exists between integrated reporting information disclosure by CBD and what information is availed publicly by other media. No congruent alignment of actions and CBD's talk was found and this information failure has caused a drop in trust in CBD by investors. It is presumed that the banks integrated report is a means by which management discloses or withholds information with the intention of protecting their own interest and at their own discretion. The conclusion arrived at from the findings is a proposal to co-opt integrated reporting as a way of improving legitimacy through trust, reputation and social capital by putting in place appropriate strategies’ for impression management.
Gitahi
et al.
| [13] | Gitahi, J., Nasieku T., & Memba, F. (2018). Corporate social responsibility disclosure and the value relevance of annual reports for listed banks in Kenya. European Scientific Journal, 14(4), 329349. https://doi.org/10.19044/esj.2018.v14n4p329 |
[13]
on investigating the influence of disclosing corporations social responsiveness on value relevance of information related to accounting, base their study on annual reports of quoted banks in Kenya. The study tasked to ascertain whether corporate social responsibility disclosures influenced investment decisions. On the bedrock of signaling theory, agency theory and capital need theory, the investigation considered a survey research design. The focus population for the research composed of all the listed banks. A survey questionnaire administered to financial analysts was used to collect primary data, while, secondary data was sourced from annual reports of the banks for covering years 2010-2015 using a tabular checklist. Content analysis, descriptive statistics, correlation and regression methods were used for data analysis. The findings indicate a realization of positive perception of investors as a result of corporate social responsibility disclosures, thus, improving the value relevance of accounting information contained in the annual reports. Further, the link between corporate social responsibility disclosure and average market prices per share of quoted companies in Kenya was significant and positive.
Rhoda
et al.
| [37] | Rhoda, W. V., Namusonge, G. S., & Simiyu, A. (2018). Influence of relational capital initiatives on value creation in public Universities in Kenya. International Journal of Social Sciences & Information Technology, 4(10), 228-244. ISSN 2412-0294. |
[37]
, using a sample of Kenyan public Universities assessed the influence of relational capital initiatives (collaborative business intelligence, relationship with customers and relationship with partners) on the value creation process. Mixed methods of research design incorporating both quantitative and qualitative methods, considering all the deans and chairmen of departments of six public universities as the focus population from whom primary data was sourced using questionnaires. Correlational and regression methods as descriptive and inferential statistics respectively were the means by which data was analyzed. The study verdict provide prove that relational capital has positively and significantly associated with value creation. However, the study findings can only be limited to knowledge based organizations.
Schmid and Sender
| [43] | Schmid, A., & Sende A.(2019). How social capital influences performance in family firms: The moderating role of nepotism. The International Journal of Human Resource Management. 1-21, https://doi.org/10.1080/09585192.2019.1674355 |
[43]
. studied on how social capital influence performance in family firms as moderated by nepotism. The study aimed at establishing whether organization social capital is positively interconnected with performance and whether nepotism moderates this relationship. Employing survey research design a sample of 2,355 firms was designated from a total population of 597,000 family firms using a self-identification approach, which ended in a final sample of 77 firms. Data collected using e-mailed or post mailed questionnaires was analyzed by the use of ordinary least squares method. From the study results it is revealed that nepotism is a critical element in the determination of the extent to which family firms could profit from organization social capital.
Rotimi
et al. | [38] | Rotimi, O. O., Adegbie, F. F., & Rufus, A. I. (2019). Effect of integrated reporting practices on improved stakeholders relationship in Nigerian quoted manufacturing companies. International Journal of Business and Management Invention (IJBMI), 8(7), 37-46. |
[38]
motivated by the demand of stakeholders more information disclosure for improved stakeholder relationships, examined how <IR> practices consisting content elements (external environment, governance, BM, risks and opportunities, strategy and resource allocation, performance, outlook and basis of presentation) can help better such association in manufacturing firms quoted on the Nigerian stock exchange. Hinging the paper on the stakeholder and legitimacy theories, the paper employed survey research design and on the basis of event criterion a sample of 675 respondents was identified randomly from departments that applied <IR> information most. Using a questionnaire data was amassed from the sample respondents and analyzed with the support of descriptive and inferential statistics. The results recorded an improved stakeholder relationship of quoted Nigerian manufacturing companies.
Nguyen and Ha
| [33] | Nguyen, H. T. T., & Ha, T. M. (2020). Social capital and firm performance: A study on manufacturing and services firms in Vietnam. Management Science Letters, 10, 2571–2582 https://doi.org/10.5267/j.msl.2020.3.038 |
[33]
study focused on social capital and firm performance of Vietnamese manufacturing and service firms. The paper specifically analyzed the structural, relational and cognitive dimensions of social capital on firm performance. The paper was grounded on the social capital and social exchange theories. A cross-sectional research design was employed and primary data collected from a 153 listed companies that were selected using snowball and convenience sampling methods. The data analysis techniques employed entailed both exploratory and confirmatory factor analysis and evaluation of associations done using structural equation modeling. The study findings reveal a positive relationship between the social capital dimensions and firm performance and that knowledge transfer and innovation variables act as mediators.
Iorun
et al.| [21] | Iorun J. I, Abanyam E. I, Iorlaha M., (2023). Relational Capital Disclosure and Market Value of Selected Quoted Companies in Nigeria. International Journal of Accounting, Finance and Risk Management. Vol. 8, No. 4, pp. 94-103. https://doi.org/10.11648/j.ijafrm.20230804.12 |
[21]
carried out an examination on the relationship between relational capital disclosure and Market value of selected Nigerian listed companies. Particularly the study examined the relationship between customer services, distribution channels and strategic partnerships disclosure and market value. Stemming the study on the signaling theory, ex-post facto research design was applied. All the 151 companies form 11 sectors listed in the exchange group of Nigeria as at December 2022 formed the research population. 32 companies were sampled on the ground that; the company was incorporated and listed in the Nigerian stock exchange before 2013, audited annual report published by the Nigerian stock exchange for the period 2013-2022 and the company contained relevant disclosure on relational capital components in the annual reports. Secondary data obtained was described by way of descriptive statistics, and analysed using correlation and regression analysis. The study results show customer service disclosure had a statistically insignificant effect on Tobin’s Q. On the other hand, disclosures in relation to distribution channels positively and significantly influenced firm value. Furthermore, the association between strategic partnership disclosure and firm value was positive and significant.
2.3. Summary of Literature Gaps
On the basis of the reviewed studies, mixed results have been affirmed. Such results can be reasonably attributed to the application of different methodologies, differences in the unit of analysis, differences in adopted reporting frameworks, variation in sample sizes, industry type and country specific factors. Most studies have considered the direct effects of social and relationship capital disclosure and firm value
| [32] | Ngari, J. M. (2014). Relational capital and business performance of pharmaceutical firms in Kenya. International Journal of Science and Research (IJSR), 3(8). 1110-1115. |
| [33] | Nguyen, H. T. T., & Ha, T. M. (2020). Social capital and firm performance: A study on manufacturing and services firms in Vietnam. Management Science Letters, 10, 2571–2582 https://doi.org/10.5267/j.msl.2020.3.038 |
| [21] | Iorun J. I, Abanyam E. I, Iorlaha M., (2023). Relational Capital Disclosure and Market Value of Selected Quoted Companies in Nigeria. International Journal of Accounting, Finance and Risk Management. Vol. 8, No. 4, pp. 94-103. https://doi.org/10.11648/j.ijafrm.20230804.12 |
[32, 33, 21]
. No study was available considering the mechanism through which this direct relationship is accomplished. This has motivated the researcher to carry out a comparative study from a developing country context, Kenya and South Africa with the aim of providing additional evidence on the role played by the business model on the association between social and relationship capital disclosure and value of listed companies in the <IR> context.
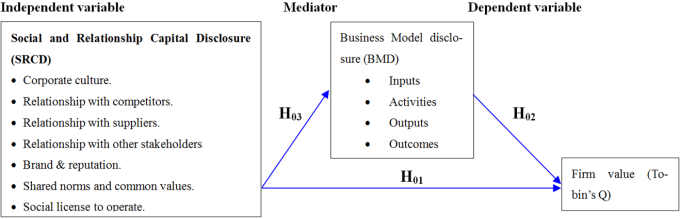
2.4. Conceptual Framework
Figure 1. Conceptual model.
3. Materials and Methods
3.1. Population, Sample and Data Collecting
The study target population was made up of 209 firms comprising of 64 and 145 firms hailing from Kenya and South Africa respectively by December, 2020. The companies were categorized using the industry sector classification criteria prescribed by the Global Industry Classification Standard (GICS) that applies to companies globally. The GICS classifies industries into 11 sectors namely; communication services, consumer discretionary, consumer staples, energy, financials, health care, industrials, information technology, materials, real estate and utilities. This classification was adopted for this inquiry as presented in
Table 1 below;
Table 1. Target Population by Industry Sector.
Industry sector | Kenya | South Africa | Total |
Communication services | 4 | 5 | 9 |
Consumer discretionary | 7 | 22 | 29 |
Consumer staples | 11 | 10 | 21 |
Energy | 1 | 4 | 5 |
Financials | 23 | 33 | 56 |
Health care | - | 4 | 4 |
Industrials | 10 | 15 | 25 |
Information technology | - | 10 | 10 |
Materials | 4 | 32 | 36 |
Real estate investments | 1 | 9 | 10 |
Utilities | 3 | 1 | 4 |
Total | 64 | 145 | 209 |
Source: Researcher, 2024
3.1.1. Sample and Sampling Design
Since the focus of the study was on quoted companies in the Nairobi and Johannesburg securities exchanges, that had adopted <IR>, non-probability sampling design was utilized to select the desired sample. Purposeful sampling using judgmental method was applied to identify the sample for this study for both the Kenyan and South African case. According to Patton
| [35] | Patton. M. Q. (2002). Qualitative research and evaluation methods (3rd ed.). Thousand Oaks, CA: Sage Publications. |
[35]
purposeful sampling as a method is applied in research for the purpose of identification and selection of cases that are rich in certain required information for optimal use of scarce resources. On this basis the sample comprised of listed firms from the various industry sectors that had adopted integrated reporting for Kenya, and for South Africa firms contained in the IIRC’s website, <IR> examples database, as <IR> reporters and listed on the JSE by December, 2020 were considered. Prior studies that have applied the same technique include
| [29] | Melloni, G., Stacchezzini, R., & Lai, A. (2016). The tone of business model disclosure: an impression management analysis of the integrated reports. Journal of management and governance, 20 (2), 295-320. https://doi.org/10.1007/s10997-015-9319-z |
| [44] | Stefan, S., & Branislav, Z. (2016). Relationship between business strategy and business model studied in a sample of service companies. Journal of Competitiveness, 8(4), 72-84. https://doi.org/10.7441/joc.2016.04.05 |
| [23] | Kılıç, M. & Kuzey, C. (2018), "Determinants of forward-looking disclosures in integrated reporting", Managerial Auditing Journal, 33 (1), 115-144. https://doi.org/10.1108/MAJ-12-2016-1498 |
| [47] | Yusof, S. M. (2018). Social environmental disclosure between GRI-Sustainability reporting and IIRC-Integrated reporting among European companies. International Business Research, 11(6), 185-198. https://doi.org/10.5539/ibr.v11n6p185 |
[29, 44, 23, 47]
.
3.1.2. Sample Frame
The sampling frame comprised of 209 firms derived from Kenya and South Africa by the end of December 2020.
3.1.3. Sampling Size
Listed firms that were better placed in providing the requisite information on integrated reporting capitals and business model disclosures were encompassed in the sample. Thus, the sample size for this study was 137 listed firms. The sample size was determined by applying the formular below as advanced by Yamane
| [46] | Yamane, T. (1967). Statistics, An Introductory Analysis, (2nd ed.). New York: Harper and Row. |
[46]
.
Where; n = Sample Size and N = Population size
Thus, assuming 95% level of confidence the study sample size of 137 firms will be determined as;
n=N/[1+N(e)2]=209/[1+209(0.05)2]=137firms
This comprised of 19 and 118 listed firms from Kenya and South Africa respectively across the various industry sectors as presented in
Table 2 below;
Table 2. List of sampled <IR> companies for Kenya and South Africa.
Industry sector | Kenya | South Africa | Total |
Communication services | - | 3 | 3 |
Consumer discretionary | 1 | 16 | 17 |
Consumer staples | 2 | 10 | 12 |
Energy | - | 3 | 3 |
Financials | 14 | 24 | 38 |
Health care | - | 4 | 4 |
Industrials | 1 | 9 | 10 |
Information technology | - | 9 | 9 |
Materials | - | 31 | 31 |
Real estate investments | - | 9 | 9 |
Utilities | 1 | - | 1 |
Total | 19 | 118 | 137 |
Source: Researcher, 2024
3.1.4. Sampling Procedure
For the Kenyan case, the study employed criterion sampling strategy in which listed firms that had embraced integrated reporting were selected for the study. Accordingly, this procedure allows advance determination of the criteria that differentiates the participants from others. This procedure was appropriate for this study as the predetermined criteria for inclusion in the sample relate to integrated reporting which is voluntary in Kenya. For South African case where integrated reporting is compulsory, firms that had adopted integrated reporting and whose reports were contained in the IIRC’s website <IR> examples database, as <IR> reporters and listed on the JSE qualified for inclusion in the sample. This sampling strategy has been employed in prior studies
| [1] | Anuonye, N. B. (2016). Effect of intellectual capital on return on assets of insurance firms in Nigeria. Global Journal of Management and Business Research, 16(1), 41-52. |
[1]
.
3.2. Data Collection
Secondary sources were the main source of data for this study. Published annual report and financial statements or integrated report and financial statements were obtained from the listed companies' websites or hard copies.
3.2.1. Instrumentation
The study employed a checklist as the main data collection instrument that was structured around the variables of interest (social and relationship capital disclosure and business model) and the specific items of disclosures required in the published integrated reports and financial statements. The <IR> capital (social and relationship) and business model aspects were subdivided into disclosure indicators based on the IIRC's
, framework consisting of 42 items of disclosure in relation to social and relationship capital and business model categories; social and relational capital (7 items), BM identification (2 items), BM inputs (8 items), BM business activities (12 items), BM outputs (3 items) and BM outcomes (10 items). A 4 point likert scale scoring method was employed to provide a reflection of the extent of disclosure of the integrated reporting capitals and business model aspects in the integrated reports of the listed companies. A score of 0 indicates non-disclosure of an item, meaning no information is provided on the aspect, while, a score of 1 indicates limited disclosure, meaning the item is only mentioned in the report, a score of 2 indicates a mention of the aspect with brief explanation of specific information, and a score of 3 as a reflection of full disclosure involving detailed discussions incorporating the actions of the company and quantification of the aspect in monetary terms.
It is a useful tool for evaluating the required information from the published integrated reports and financial statements. The same instrument has been employed by prior studies for the purpose of data collection
| [9] | Dyduch, J. (2017). Financial environmental disclosure in the annual reports of listed companies in Poland. International Journal of Trade, Economics and Finance, 8(3), 169-174. https://doi.org/10.18178/ijtef.2017.8.3.557 |
| [39] | Smit, Scholtz, & Mans-Kemp (2018). Assessing the extent of application of integrated reporting guidelines by South African banks. Southern African Journal of Accountability and Auditing Research, 20(1), 57-69. https://hdl.handle.net/10520/EJC-11fd63412f |
| [48] | Zhou, S., Simnett, R., & Green, W. (2017). Does integrated reporting matter to the capital market? Journal of Accounting, Finance & Business studies, Abacus, 53(1), 94-132. https://doi.org/10.1111/abac.12104 |
[9, 39, 48]
.
3.2.2. Data Collection Procedures
The research used secondary data that was compiled from audited integrated report and financial statements of the quoted companies covering the period 2018-2020. The three-year period is consistent with previous research
| [17] | Hieu, P. D., Anh, D. V., Giang, N. T. M., Ngoc, H. T. B., & Lam, N. T. H. (2022). Human resource accounting disclosure and firm value: An empirical study in Vietnam. Academy of Accounting & Financial Studies Journal, 26 (2), 1-09. |
| [41] | Simoni L., Schaper S., & Nielsen C. (2022). Business Model Disclosures, Market Values, and Earnings Persistence: Evidence From the UK. Journal of Accounting, Finance and Business studies ABACUS, Vol. 58 (1) https://doi.org/10.1111/abac.12233 |
| [39] | Smit, Scholtz, & Mans-Kemp (2018). Assessing the extent of application of integrated reporting guidelines by South African banks. Southern African Journal of Accountability and Auditing Research, 20(1), 57-69. https://hdl.handle.net/10520/EJC-11fd63412f |
| [45] | Szewieczek, A., Dratwinska-Kania, B., Ferens, A.(2021). Business Model Disclosure in the Reporting of Public Companies—An Empirical Study. Sustainability, 13, 10088. https://doi.org/10.3390/su131810088 |
[17, 41, 39, 45]
to test after implementation effects. This period was chosen as it represents a time when the adoption of <IR> has started to gain momentum in various jurisdictions and most Kenyan listed firms started preparing integrated reports from the year 2018. In cases where relevant data missed from the set of audited accounts, NSE handbook was used since it contains summaries of past financial information of the listed Kenyan companies. The information on company integrated reports contained in IIRC website on <IR> examples database, <IR> reporters for the case of JSE listed firms was used for this study.
Tobin's Q a market based performance measure was used as a proxy for firm value, computed as market value of equity plus book value of total liabilities divided by book value of total assets. Where, Market value of equity (market capitalization= market price per share*shares outstanding at the balance sheet date) was determined by establishing the market value per share taken as an average value 5 months after the financial year end multiplied by shares outstanding at the financial position date. The 5 month period is within the period applied by prior studies which considered the impact of disclosures on market value at 3 and 6 months after the fiscal year respectively, to allow for the time-lag effect between disclosure and use of information by investors. This is for assurance that the investors have assessed the published information as organizations' are legally obligated to publish their financial statement reports 3 months after financial year end. This information was extracted from daily stock trading records of NSE and JSE websites.
3.3. Data Analysis Methods
3.3.1. Descriptive Statistics
The profile of the various companies that were utilized in the study was presented using frequency tables. The actual disclosure of the various items as categorized on the checklist was summarized using the mean in order to establish the average disclosure level under each category and overall for the 3 years. While, standard deviations were employed to inform on the variability of the data points in the data set. Minimum and maximum scores were also used. The descriptive analysis provided the degree or extent to which <IR> practices relating to social and relationship capital and business model had been adopted in corporate reports. This methodology has been employed by previous researchers involved in similar studies.
The disclosure level for the respective variables was computed according to the following un-weighted disclosure index.
(2)
Where;
DIIR = Disclosure index of respective <IR> variable
di = Disclosure score for various indicators of disclosure in respect to <IR> variable
n = Number of indicators that characterize the variable of disclosure based on the IIRC's (2013) framework and CIMA; IFAC; PwC (2013) business model background paper for <IR>
Same method has been applied in prior studies
| [5] | Bhuyan, M., Lodh, S. C. & Perera, N. (2017). The effects of corporate social disclosure on firm performance: Empirical evidence from Bangladesh. Accounting and Finance Association of Australia and New Zealand Conference, 1-36. https://ro.uow.edu.au/buspapers/1218 |
| [17] | Hieu, P. D., Anh, D. V., Giang, N. T. M., Ngoc, H. T. B., & Lam, N. T. H. (2022). Human resource accounting disclosure and firm value: An empirical study in Vietnam. Academy of Accounting & Financial Studies Journal, 26 (2), 1-09. |
| [40] | Soni, M., & Bhanawat, S. S. (2016). Disclosure pattern of six capitals under integrated reporting framework: Selected South African Companies'. Indian Journal of Accounting (IJA), XLVIII (2), 87-101 ISSN: 0972-1479 (Print) 2395-6127 (Online). |
[5, 17, 40]
to establish disclosure index for corporate social disclosure, human resource accounting disclosure and business model disclosure respectively. The range of disclosure index values were between 0 and 3. An index value close to 3 will suggest a higher level of disclosure and compliance with the international <IR> framework in corporate reporting, while a value close to 0 will mean the opposite. The average disclosure indices computed on the various variables were then linked to firm value measured by Tobin’s Q.
3.3.2. Inferential Statistics
Pearson's correlation coefficient was used to assess the association among integrated reporting capitals disclosure, business model and firm value measured by Tobin's Q. The effect-size of the correlation coefficients was assessed using Cohen’s q and Fisher’s r to Z transformation methods.
To test for the direct relationship of the effect of <IR> capital disclosure of social and relationship on firm value as hypothesized in H01-H02, simple and multiple linear regression analysis was conducted. To assess the effect-size of regression models Cohen’s f2 was applied.
Further, mediation analysis as hypothesized was conducted using stepwise regression analysis proposed by Judd and Kenny
as presented in equations (
3)-(
5) below;
Where
In equation (
3),
‘c’ represents the total (unmediated) effect of the exposure variable X on the outcome variable Y.In equation (
4),
‘a’ represents the effect of the exposure variable X on the mediator variable M.In equation (
5),
‘c1’ represents the direct effect of the exposure variable X on the outcome variable Y, and b represents the effect of the mediator variable M on the outcome variable Y.In all three equations, i represents the intercept and ε represents the error term.
3.3.3. Mediation Analysis Steps
The existence of mediation effect was tested by sequentially verifying four conditions as proposed by Baron & Kenny
| [2] | Baron, R. M., & Kenny, D. A. (1986). The moderator-mediator variable distinction in social psychological research: Conceptual, strategic and statistical considerations. Journal of Personality and Social Psychology, 51, 1173-1182. https://doi.org/10.1037/0022-3514.51.6.1173 |
[2]
. for the determination of the total effect and indirect effects.
Step 1: Testing for the total (unmediated) effect ‘c’
To satisfy condition 1 of mediation analysis in which independent variables (social and relationship capital disclosure) and the dependent variable (firm value) must be related in the absence of the mediator. This established the regression weight ‘c’ an estimation of the total effect.
This was verified using equation (
6) linear regression model Hypothesized as;
Where;
i =constant term
c= regression coefficient relating X to Y
e= random errors (the part of Y that isn't explained by X)
To test for the total effect ‘c’ for H01 the following models were used.
Where;
FVit is the dependent variable Firm value measured by Tobin’s Q, i is the Intercept, c is the Coefficient of the independent variables comprising, SRCDit (Social and relationship capital) and eit is the error term.
To test for the direct and indirect effects that are critical for determining mediation, Baron and Kenny
| [2] | Baron, R. M., & Kenny, D. A. (1986). The moderator-mediator variable distinction in social psychological research: Conceptual, strategic and statistical considerations. Journal of Personality and Social Psychology, 51, 1173-1182. https://doi.org/10.1037/0022-3514.51.6.1173 |
[2]
proposed satisfaction of two conditions;
Step 2: Testing for the indirect path ‘a’
To satisfy condition 2 of mediation analysis in which independent variables (social and relationship capital) and mediator variable (business model) must be related, the study used the following linear regression analysis of M over X to test for the indirect path ‘a’, stated as;
Where;
i = constant term
a=regression coefficient relating X to M
e=random errors (the part of M that isn't explained by X)
Step 3: Testing for the indirect effect path ‘b’ and direct effect ‘c1’
To satisfy condition 3 of mediation analysis in which the mediating variable (Business model) and the dependent variable (Firm Value) must be related on controlling the effect of X, the study employed multiple linear regression analysis of Y over X and M to determine the indirect effect path ‘b’ and direct effect ‘c1’.
Thus;
Where;
i = constant term
c1= regression coefficient relating X to Y on controlling for M.
b= regression coefficient relating M to Y on controlling for X.
e= random errors (the part of Y that isn't explained by X and M)
Step 4: Determining the existence and nature of mediation
Condition 4 of mediation analysis provide that the relationship between the independent variable (social and relationship capital) and dependent variable (firm value) must be reduced significantly when controlling for the effect of the mediating variable (business model).
That is, the coefficient
c1 (direct effect) must be smaller than coefficient
c (total effect). Baron & Kenny
| [2] | Baron, R. M., & Kenny, D. A. (1986). The moderator-mediator variable distinction in social psychological research: Conceptual, strategic and statistical considerations. Journal of Personality and Social Psychology, 51, 1173-1182. https://doi.org/10.1037/0022-3514.51.6.1173 |
[2]
. point out explicitly that "the strongest mediation demonstration is when
c1 is zero". For this purpose the unstandardized beta coefficients
c1 (direct effect) and
c (total effect) were compared to establish existence of mediation.
Step 2 and 3 were then conducted in order to establish the direct effect ‘c1’ and indirect effects ‘a’ and ‘b’ using the following models to test hypothesis H02.
FVit=i3+c11SRCDit+b1BMDit+e3(11)
On the basis of the above relationships Baron and Kenny
| [2] | Baron, R. M., & Kenny, D. A. (1986). The moderator-mediator variable distinction in social psychological research: Conceptual, strategic and statistical considerations. Journal of Personality and Social Psychology, 51, 1173-1182. https://doi.org/10.1037/0022-3514.51.6.1173 |
[2]
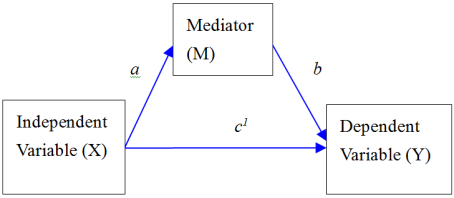
specified a statistical mediation path diagram as presented in
Figure 2 below, which satisfies the stepwise regression process to test mediation effect.
Figure 2. Mediation analysis model.
Accordingly, the data was to be in harmony with total mediation hypothesis if the relationship between independent variable (social and relationship capitals) and dependent variable (firm value) completely disappears when controlling for the mediator (the coefficient ‘
c1’ is zero), while partial mediation will be claimed when the association between independent variables (social and relationship capitals) and dependent variable (firm value) is significantly reduced when mediator is controlled but does not completely disappear (i.e. when the absolute value of coefficient
‘c1’ is small than ‘
c’ and greater than zero at the same time). The direct effect is determined as
c-ab =
c1 (the beta coefficients of ‘
c’ total effect already established in equation
1 minus the product of coefficient ‘
a’ and ‘
b’ established in equations
2 & 3).
However, Kenny
et al post an argument that not all the conditions must be satisfied in order to claim mediation. Accordingly, MacKinnon
et al referred to this context as inconsistent mediation. Inconsistent mediation is said to occur if the coefficient of the direct effect
‘c1’ were opposite in sign to indirect effects ‘ab’. In this scenario the mediator is considered as a suppressor variable. This explains why some conditions may fail to be met yet mediation is still reported. Further, Kenny
et al | [24] | Kenny, D. A., Kashy, D. A., & Bolger, N. (1998). Data analysis in social psychology. In D. Gilbert, S. T. Fiske, & G. Lindzey (Eds.), The handbook of social psychology (4th ed. pp. 223-265). New York: McGraw-Hill. |
[24]
, expound that with inconsistent mediation, sometimes the direct effect
‘c1’ is even larger than the total effect
‘c’ and the mediated effect
'ab’ may explain more than 100% of the total effect.
Further, to assess the variance accounted for in the mediation models identified above the study adopted R
2 effect-size measures of mediation analysis proposed by Fairchild
et al.
| [11] | Fairchild, A. J., Mackinnon, D., Taborga, M. P., & Taylor, A. B. (2009). R2 effect-size measures for mediation analysis. Behavior Research Methods, 41(2), 486 498. https://doi.org/10.3758/BRM.41.2.486 |
[11]
stated as;
R2med=r2YM–(R2Y,MX–r2YX)(12)
Where;
R2med = Portion of variance explained by the mediated effect
r2MY = The squared correlation of Y and M
r2XY = The squared correlation of Y and X
R2Y, MX = The squared multiple correlation of Y jointly explained by M and X
This measure was considered appropriate to complement other regularly applied effect-size measures such as proportion mediated and mediation ratio that are considered unstable in cases where several parameters are combined and are predominantly biased to small sample sizes as the methods tend to perform better with samples > 500. While, partial r
2 and standardized regression coefficients focus on the relation between two variables in the mediation model. R
2 effect-size measures offers a means to carry out an evaluation of both component paths and the overall mediated effect in mediation models
| [11] | Fairchild, A. J., Mackinnon, D., Taborga, M. P., & Taylor, A. B. (2009). R2 effect-size measures for mediation analysis. Behavior Research Methods, 41(2), 486 498. https://doi.org/10.3758/BRM.41.2.486 |
[11]
.
3.3.4. Bootstrapping
Using the sampling distribution, the total effect and indirect effect between constructs was estimated by taking a sample size n from the dataset. A number of resampling taken between 1000 and 5000 times
| [36] | Preacher, K. J., & Hayes, A. F.(2008). Asymptotic and re-sampling strategies for assessing and comparing indirect effects in multiple mediator models. Behavior Research Methods, 40 (3), 879-891. https://doi.org/10.3758/BRM.40.3.879 |
[36]
. The mean and standard error was computed for every sample that led to the development of a resampling distribution for the estimates. At the 95% confidence interval, values for the total effects, direct effects and indirect effects were tabulated. Thus, the bootstrapping results were then compared with the conventional mediation test results for confirmation. The results most often are expected to be the same. However, if a variation occurs, then bootstrapping results prevail. Process Macro procedure for SPSS Version 4.2 Model 4 developed by Hayes
| [18] | Hayes, A. F. (2013). Introduction to Mediation, Moderation, and Conditional Process Analysis: A Regression-Based Approach, (1st ed. pp. 34-40). London & New York: Guilford Press. |
[18]
was utilized in SPSS version 21.0.
3.3.5. Mediation Testing Assumptions
In testing for mediation it is assumed that; the Mediator lies on the causal pathway between the exposure and the outcome such that the predictor causes the mediator and the mediator causes the outcome. There is a possibility to manipulate the exposure and mediator theoretically, as a minimal condition for claiming causal mediation. There should be no confounding if causal mediation is to be claimed in the sense that there is no third variable influencing the independent and mediator, independent and outcome and mediator and outcome variables relationships. No interaction is expected between variables. Usual model assumptions for linear or logistic regression apply.
4. Results
The researcher conducted a single mediator analysis with panel data set (n = 54, and n = 318) for Kenya, NSE listed firms and South Africa, JSE listed firms respectively. The data was analysed as discussed below.
4.1. Descriptive Statistics
Descriptive statistics was used to analyze the data by way of depicting or describing it without any intention of making either conclusions or generalizations from the results. In this part, the indicators of each variable processed were described in terms of; minimum, maximum, mean and standard deviation.
4.1.1. Descriptive Statistics of Variable Indicators
Descriptive statistics was conducted on the various indicators related to social and relationship capital disclosure across firms listed in the NSE and JSE. The results are as presented in
Table 3 below.
Table 3. Descriptive statistics of social and relationship capital disclosure indicators.
COUNTRY | N | Min. | Max. | Mean | Std. Dev. |
Kenya | E1-Corporate culture | 54 | .00 | 3.00 | 1.6481 | .73092 |
E2-Relationship with competitors | 54 | .00 | 3.00 | 1.4259 | .66167 |
E3-Relationship with suppliers | 54 | .00 | 3.00 | 2.0185 | .78885 |
E4-Relationship with other stakeholders | 54 | 1.00 | 3.00 | 2.4630 | .57340 |
E5-Brand and reputation | 54 | 1.00 | 3.00 | 2.0741 | .60973 |
E6-Shared norms and common values | 54 | .00 | 3.00 | 1.7778 | .71814 |
E7-Social license to operate | 54 | 1.00 | 3.00 | 2.1667 | .74606 |
Valid N (listwise) | 54 | | | | |
South Africa | E1-Corporate culture | 318 | .00 | 3.00 | 1.8302 | .52936 |
E2-Relationship with competitors | 318 | .00 | 3.00 | 1.8113 | .59089 |
E3-Relationship with suppliers | 318 | .00 | 3.00 | 2.5000 | .73981 |
E4-Relationship with other stakeholders | 318 | 1.00 | 3.00 | 2.4434 | .52832 |
E5-Brand and reputation | 318 | .00 | 3.00 | 2.0283 | .54670 |
E6-Shared norms and common values | 318 | .00 | 3.00 | 1.7453 | .63138 |
E7-Social license to operate | 318 | .00 | 3.00 | 2.2233 | 1.02823 |
Valid N (listwise) | 318 | | | | |
Source: Research data, 2024
The description portrayed in
Table 3 show that for Kenyan listed companies relationship with other stakeholders (customers and business partners) component of social and relationship capital as the most disclosed (
N=54,
M = 2.4630,
SD = .57340). Whereas, disclosures of relationship with competitors aspect being the least disclosed (
N =54,
M = 1.4259,
SD = .66167). On the other hand, for companies listed in JSE, South Africa,
Table 4.8 delineates that relationship with suppliers component of social and relationship capital is given prominence (
N=318,
M = 2.5000,
SD = .73981). Whilst, a score of (
N =318,
M = 1.7453,
SD = .63138).
Corresponding to shared norms and common values element show least disclosure. The results are in line with earlier studies in which relationship capital disclosures above 50% in respect of customer service and strategic partnerships was reported.
4.1.2. Summary Descriptive Statistics of Business Model Disclosure Indicators by Country
The summary descriptive statistics of business model disclosure on the basis of country was examined. The comparative summary statistics is as provided in
Table 4 below in respect to Kenya and South Africa respectively.
Table 4. Summary descriptive statistics of business model disclosure.
COUNTRY | N | Min. | Max. | Mean | Std. Dev. | Skewness | Kurtosis |
Statistic | Statistic | Statistic | Statistic | Statistic | Statistic | Std. Error | Statistic | Std. Error |
Kenya | BMInputs | 54 | .00 | 3.00 | 1.9444 | .70247 | -.635 | .325 | -.310 | .639 |
BMActivity | 54 | 1.17 | 2.83 | 2.1188 | .41227 | -.117 | .325 | -.722 | .639 |
BMOutputs | 54 | .67 | 3.00 | 1.7901 | .75596 | -.026 | .325 | -1.381 | .639 |
BMOutcomes | 54 | 1.30 | 3.00 | 2.2889 | .47011 | -.503 | .325 | -.743 | .639 |
BMD | 54 | .81 | 2.85 | 2.0356 | .49603 | -.370 | .325 | -.846 | .639 |
Valid N (listwise) | 54 | | | | | | | | |
South Africa | BMInputs | 318 | .00 | 3.00 | 2.1358 | .70086 | -1.362 | .137 | 1.576 | .273 |
BMActivity | 318 | 1.08 | 2.75 | 1.8483 | .32145 | .311 | .137 | -.250 | .273 |
BMOutputs | 318 | .67 | 3.00 | 2.1960 | .65901 | -.670 | .137 | -.421 | .273 |
BMOutcomes | 318 | .70 | 3.00 | 2.2899 | .36911 | -.925 | .137 | 1.578 | .273 |
BMD | 318 | 1.03 | 2.92 | 2.1175 | .38516 | -.420 | .137 | -.270 | .273 |
Valid N (listwise) | 318 | | | | | | | | |
Source: Research data, 2024
On the basis of
Table 4, Kenyan listed companies data business model outcomes component was most disclosed with (
N=54,
M = 2.2889,
SD = .47011). On the other hand, disclosures in relation to business model inputs was least (
N =54,
M =1.7901,
SD = .75596). This finding partly contradicts that of Simoni
et al which reported average disclosure of business model inputs.
Comparably, for South Africa, business model outcome component received most disclosure with (
N=318,
M=2.2899,
SD= .36911). Whereas, disclosures in relation to business model activities was given least consideration of (
N =318,
M =1.8483,
SD = .32145) by JSE listed companies. This result corroborates the finding of
| [29] | Melloni, G., Stacchezzini, R., & Lai, A. (2016). The tone of business model disclosure: an impression management analysis of the integrated reports. Journal of management and governance, 20 (2), 295-320. https://doi.org/10.1007/s10997-015-9319-z |
| [40] | Soni, M., & Bhanawat, S. S. (2016). Disclosure pattern of six capitals under integrated reporting framework: Selected South African Companies'. Indian Journal of Accounting (IJA), XLVIII (2), 87-101 ISSN: 0972-1479 (Print) 2395-6127 (Online). |
[29, 40]
in which business model outcome components were dominantly disclosed as less business model inputs, activities and outputs related components exhibited least disclosures. In addition, the overall business model disclosure was greater for South Africa (
N =318,
M =2.1175,
SD = .38516) compared to Kenya (
N =54,
M =2.0356,
SD = .49603. Nevertheless, the variation in business model disclosure among the studied companies was greater for Kenya compared to South Africa as indicated by the difference in the standard deviation. The finding uphold the results of the study by Szewieczek
et al in which same degree disclosures of overall business model components by integrated reporting firms and non-integrated report preparers was found.
Accordingly, in both countries business model outcomes is the most disclosed component of the business model. This can be ascribed to the fact that investors as major users of the information contained in integrated reports are mainly interested on the entities performance in terms of shareholders return, profit/(loss) generated, the entity’s contribution to the economy in terms of improving the standard of living and customer satisfaction. This information is contained in the outcomes section of the entity’s business model. Thus, managers tend to disclosure more of that information to meet the investor needs.
4.1.3. Descriptive Statistics of Study Variables
Table 5. Summary Descriptive Statistics of study variables.
COUNTRY | N | Minimum | Maximum | Mean | Std. Deviation | Skewness | Kurtosis |
Statistic | Statistic | Statistic | Statistic | Statistic | Statistic | Std. Error | Statistic | Std. Error |
Kenya | SRCD | 54 | 1.00 | 2.86 | 1.9630 | .45361 | -.268 | .325 | -.197 | .639 |
BMD | 54 | .81 | 2.85 | 2.0356 | .49603 | -.370 | .325 | -.846 | .639 |
Valid N (listwise) | 54 | | | | | | | | |
South Africa | SRCD | 318 | .86 | 2.86 | 2.1545 | .29523 | -1.029 | .137 | 1.824 | .273 |
BMD | 318 | 1.03 | 2.92 | 2.1175 | .38516 | -.420 | .137 | -.270 | .273 |
Valid N (listwise) | 318 | | | | | | | | |
Source: Research data
As displayed in
Table 5 above, overall, the <IR> capital disclosure of social and relationship capital expose that South Africa listed firms where <IR> is mandatory disclosure was higher (
N =318,
M = 2.1545,
SD = .29523) compared to Kenya (
N =54,
M = 1.9630,
SD = .45361). Further, in regard to reported standard deviation Kenyan listed companies highly varied in the disclosures compared to South Africa Equally, overall business model disclosures in relation were higher in South Africa ((
N =318,
M = 2.1175,
SD = .38516) compared to Kenya (
N =54,
M = 2.0356,
SD = .49603).
Moreover, the skewness and kurtosis results portray a distribution that was approximately normal. The kurtosis value is less than 3, which means the distribution is platykurtic. Likewise, the skewness value revolved around 1, evidencing a mesokurtic distribution. Thus, the use of ordinary least squares method of estimation as a method of estimating the parameters for the purpose of hypotheses testing in the present study was applied.
4.1.4. Descriptive Statistics of Firm Value
The research also established the descriptive statistics of firm value in respect of firms listed in the NSE and JSE. The results are as presented in
Table 6 below.
Table 6. Descriptive statistics of firm value.
COUNTRY | N | Minimum | Maximum | Mean | Std. Deviation |
Kenya | FV-Firm value | 54 | .42 | 2.98 | 1.3653 | .58422 |
Valid N (listwise) | 54 | | | | |
South Africa | FV-Firm value | 318 | .24 | 3.38 | 1.1044 | .48269 |
Valid N (listwise) | 318 | | | | |
Source: Research data, 2024
Table 6 the description indicates average firm value of (
N=54,
M = 1.3653,
SD = .58422) for listed NSE companies. Whereas, average firm value of (
N=318,
M = 1.1044,
SD = .48269) is revealed for JSE listed companies.
Furthermore, the study uncovers that, the mean of firm values as proxied by Tobin’s Q, Kenyan listed firms recorded on average value of 1.3653 with a standard deviation of 0.58422, unlike South Africa with an average value of 1.1044 with a standard deviation of 0.48269. This implies that, South African companies are more appropriately valued than Kenyan listed companies. However, a study by Hieu
et al.. and Iorun
et al.
| [21] | Iorun J. I, Abanyam E. I, Iorlaha M., (2023). Relational Capital Disclosure and Market Value of Selected Quoted Companies in Nigeria. International Journal of Accounting, Finance and Risk Management. Vol. 8, No. 4, pp. 94-103. https://doi.org/10.11648/j.ijafrm.20230804.12 |
[21]
reported an average firm value (
M=1.567,
SD = .924) and (
M=1.6579,
SD = 1.1601) respectively. Evidencing overvaluation of the studied firms value in both cases.
4.2. Correlation Analysis
Pearson's correlation coefficient was determined on the data relating to Kenya and South African listed firms to assess the connection between social and relational capital disclosure and firm value. The main variables of ICD, BMD and FV were related as depicted in
Table 7 below.
Table 7. Correlation Matrix.
COUNTRY | SRCD | BMD | FV |
Kenya | SRCD | Pearson Correlation | 1 | | |
Sig. (2-tailed) | | | |
N | 54 | | |
BMD | Pearson Correlation | .566** | 1 | |
Sig. (2-tailed) | .000 | | |
N | 54 | 54 | |
FV | Pearson Correlation | .460** | -.026 | 1 |
Sig. (2-tailed) | .000 | .850 | |
N | 54 | 54 | 54 |
South Africa | SRCD | Pearson Correlation | 1 | | |
Sig. (2-tailed) | | | |
N | 318 | | |
BMD | Pearson Correlation | .554** | 1 | |
Sig. (2-tailed) | .000 | | |
N | 318 | 318 | |
FV | Pearson Correlation | .181** | .212** | 1 |
Sig. (2-tailed) | .001 | .000 | |
N | 318 | 318 | 318 |
Source: Research data, 2024
4.3. Diagnostic Tests
Diagnostic tests were carried out to ensure the suitability of the data for analysis using regression techniques. Linearity was confirmed using scatter plots in which both countries data exhibited a positive linear relationship of social an relationship capital disclosure and firm value. The multicollinearity test using variance inflation factor (VIF) and Tolerance statistic met the required threshold of VIF below 10 and Tolerance statistic above 0.2. The autocorrelation test, Durbin Watson statistic was 1.823. The was found relatively normal on the basis of the calculated skewness and Kurtosis that was within the recommended threshold of -2 to +2 and -3 to +3 respectively (refer
Table 3 above). Homoscedasticity check utilized the probability plots (P-P plot). No specific pattern was attached to the scatter plots.
4.4. Test of Hypotheses
The hypothesized associations are tested on the basis the stepwise regression models.
4.4.1. Step 1: Testing for the Total (Unmediated) Effect ‘c’
H01: Social and relationship capital disclosure has no statistically significant effect on value of listed companies between Kenya and South Africa. (Total effect c).
The total (unmediated) effect ‘c’ was estimated using comparative regression model summary, ANOVA and coefficients between Kenya and South African listed companies data as revealed below.
(i). Model Summary of Social and Relationship Capital Disclosure and Firm Value
To obtain the explanatory power of social and relationship capital disclosure on the variation of the value of listed firms between Kenya and South Africa, regression analysis was utilized. The comparative model summary is as provided in
Table 8 below.
Table 8. Comparative model summary of social and relationship capital disclosure and firm value.
COUNTRY | Model | R | R Square | Adjusted R Square | Std. Error of the Estimate |
Kenya | 1 | .460a | .212 | .197 | .52359 |
South Africa | 1 | .181a | .033 | .030 | .47547 |
a. Predictors: (Constant), SRCD
Source: Research data, 2024
In relation to
Table 8 it is shown that social and relationship capital disclosure explains the variation in firm value of NSE listed firms to the extent of 21.2% (
R2 = .212), and therefore, 78.8% of the variation can be explained by other factors not contained in the model. Then again, social and relationship capital disclosure explains the variation in firm value of JSE listed firms to the extent of 3.3% (
R2 = .033), and therefore, 96.7% of the variation can be explained by other factors not accommodated in the model.
(ii). ANOVA of Social and Relationship Capital Disclosure and Firm Value
To work out how appropriate the model was in anticipating the relationship between social and relationship capital disclosure and firm value of listed firms between Kenya and South Africa, ANOVA was exploited. The results are as illustrated in
Table 9 below.
Table 9. Comparative ANOVA of social and relationship capital disclosure and firm value.
COUNTRY | Model | Sum of Squares | df | Mean Square | F | Sig. |
Kenya | 1 | Regression | 3.834 | 1 | 3.834 | 13.984 | .000b |
Residual | 14.256 | 52 | .274 | | |
Total | 18.089 | 53 | | | |
South Africa | 1 | Regression | 2.417 | 1 | 2.417 | 10.692 | .001b |
Residual | 71.439 | 316 | .226 | | |
Total | 73.856 | 317 | | | |
a. Dependent Variable: FV
b. Predictors: (Constant), SRCD
Source: Research data, 2024
Based on the findings in
Table 7, the indication is that (
F (1,52) = 13.984,
P=.000) in relation to Kenya NSE listed firms. Nevertheless, (
F (1,316) = 10.692,
P=.001) corresponds to JSE listed firms data. The suitability of the models in predicting the association between social and relationship capital disclosure and value of firms listed in NSE and JSE is hereby confirmed.
(iii). Regression Coefficients of Social and Relationship Capital Disclosure and Firm Value
In order to unearth the effect of one unit fluctuation in social and relationship capital disclosure on value of listed firms between NSE and JSE, the researcher undertook a regression analysis. The study findings are as expressed in
Table 10 below.
Table 10. Comparative regression coefficients of social and relationship capital disclosure and firm value.
COUNTRY | Model | Unstandardized Coefficients | Standardized Coefficients | t | Sig. |
B | Std. Error | Beta |
Kenya | 1 | (Constant) | .201 | .319 | | .631 | .531 |
SRCD | .593 | .159 | .460 | 3.739 | .000 |
South Africa | 1 | (Constant) | .467 | .197 | | 2.375 | .018 |
SRCD | .296 | .090 | .181 | 3.270 | .001 |
a. Dependent Variable: FV
Source: Research data, 2024
On the basis of
Table 10, the results indicate that holding all else constant, the value of NSE, listed firms is .201. Whereas, a change in social and relationship capital disclosure by one unit will cause a positive and significant change in the value of the firm (
B =.593,
P = .000). On the other hand, the results uncover the value of JSE listed firms is .467 on holding all else constant. Whereas, a change in social and relationship capital disclosure by one unit will cause a positive and significant change in value of the firm (
B =.296,
P = .001).
Further, to assess the effect-size of the connection between social and relationship capital disclosure and firm value Cohen’s f2 was computed. The calculated f2 values disclosed (f2 =.27 & f2 = .03) as relating to Kenya and South Africa respectively.
Following Cohen’s criteria of (.02, .15 & .35) for small, medium and large effects respectively, the results suggest a medium to large effect-size of social and relationship capital disclosure on value of NSE listed firms, compared to the small to medium effect-size in the case of South African companies data. The estimated models are stated as;
The objective of the study considered the effect of social and relationship capital disclosure on value of listed companies between Kenya and South Africa. From the estimated models on testing the hypothesis, findings indicate that social and relationship capital disclosure positively and significantly influence firm value of listed firms for both countries. Thus, the study findings reject the null hypothesis that social and relationship capital disclosure has no statistically significant effect on value of listed companies between Kenya and South Africa.
The finding tally with the results of earlier studies
| [37] | Rhoda, W. V., Namusonge, G. S., & Simiyu, A. (2018). Influence of relational capital initiatives on value creation in public Universities in Kenya. International Journal of Social Sciences & Information Technology, 4(10), 228-244. ISSN 2412-0294. |
| [21] | Iorun J. I, Abanyam E. I, Iorlaha M., (2023). Relational Capital Disclosure and Market Value of Selected Quoted Companies in Nigeria. International Journal of Accounting, Finance and Risk Management. Vol. 8, No. 4, pp. 94-103. https://doi.org/10.11648/j.ijafrm.20230804.12 |
[37, 21]
in which relationship capital disclosure positively and significantly influenced value creation of knowledge based organisations. Again
| [5] | Bhuyan, M., Lodh, S. C. & Perera, N. (2017). The effects of corporate social disclosure on firm performance: Empirical evidence from Bangladesh. Accounting and Finance Association of Australia and New Zealand Conference, 1-36. https://ro.uow.edu.au/buspapers/1218 |
| [43] | Schmid, A., & Sende A.(2019). How social capital influences performance in family firms: The moderating role of nepotism. The International Journal of Human Resource Management. 1-21, https://doi.org/10.1080/09585192.2019.1674355 |
| [33] | Nguyen, H. T. T., & Ha, T. M. (2020). Social capital and firm performance: A study on manufacturing and services firms in Vietnam. Management Science Letters, 10, 2571–2582 https://doi.org/10.5267/j.msl.2020.3.038 |
[5, 43, 33]
, studies on social capital dimensions and firm performance has revealed a positive relationship.
4.4.2. Testing for the Direct Effect (c1) and Indirect Effect (ab)
H02: Business model has no statistically significant mediating effect on the relationship between social and relationship capital disclosure and value of listed companies when comparing Kenya and South Africa.
This hypothesis sought to establish the direct path (c1), the indirect path (a) and indirect path (b). The effects were determined as follows.
Step 2: Testing for the indirect path ‘a’
The relation between social and relationship capital disclosure and business model was evaluated to establish the indirect effects path ‘a’ via regression analysis. The regression model summary, ANOVA and coefficients between Kenya and South African listed firms data were as shown below.
(i). Model Summary of Social and Relationship Capital disclosure and Business Model (Indirect Effect Path ‘a’)
Social and relationship capital disclosure and business model was regressed to examine the extent to which the two variables were associated. The model summary is as provided in
Table 11 below.
Table 11. Model summary of social and relationship capital disclosure and business model.
COUNTRY | Model | R | R Square | Adjusted R Square | Std. Error of the Estimate |
Kenya | 1 | .576a | .332 | .319 | .38483 |
South Africa | 1 | .561a | .315 | .313 | .30214 |
a. Predictors: (Constant), SRCD
Source: Research data, 2024
By virtue of
Table 11 social and relationship capital disclosure explains the variation in business model of NSE listed firms to the extent of 33.2% (
R2 = .332) and therefore, 66.8% of the variation can be explained by other factors not included in the model. Yet, for JSE firms social and relationship capital disclosure explains the variation in business model to the extent of 31.5% (
R2 = .315) as such, 68.5% of the variation can be explained by other factors excluded from the model.
(ii). ANOVA of Social and Relationship Capital Disclosure and Business Model
ANOVA was deployed in order to ascertain how fit the models were in predicting the relationship between social and relationship capital disclosure and business model of listed firms between Kenya and South Africa. The results are as portrayed in
Table 12 below.
Table 12. ANOVA of social and relationship capital disclosure and business model.
COUNTRY | Model | Sum of Squares | df | Mean Square | F | Sig. |
Kenya | 1 | Regression | 3.832 | 1 | 3.832 | 25.875 | .000b |
Residual | 7.701 | 52 | .148 | | |
Total | 11.533 | 53 | | | |
South Africa | 1 | Regression | 13.276 | 1 | 13.276 | 145.433 | .000b |
Residual | 28.846 | 316 | .091 | | |
Total | 42.122 | 317 | | | |
a. Dependent Variable: BMD
b. Predictors: (Constant), SRCD
Source: Research data, 2024
The findings in relation to NSE firms, (F (1,52) = 25.875, P =.000) was reported. Alternatively, (F (1,316) = 145.433, P =.000) was reported for JSE. Both models are suitable in the determination of the association between social and relationship capital disclosure and business model.
(iii). Regression Coefficient to Predict Business Model from Social and Relationship Capital Disclosure
To determine how a unit variation in social and relationship capital disclosure affect the business model of listed firms in NSE and JSE, the researcher conducted simple regression analysis. The study findings are as displayed in
Table 13 below.
Table 13. Regression coefficient to predict business model from social and relationship capital disclosure (Indirect effect path ‘a’).
COUNTRY | Model | Unstandardized Coefficients | Standardized Coefficients | t | Sig. |
B | Std. Error | Beta |
Kenya | 1 | (Constant) | .926 | .235 | | 3.945 | .000 |
SRCD | .593 | .117 | .576 | 5.087 | .000 |
South Africa | 1 | (Constant) | .593 | .125 | | 4.744 | .000 |
SRCD | .693 | .057 | .561 | 12.060 | .000 |
a. Dependent Variable: BMD
Source: Research data, 2024
As a consequence of
Table 13 a positively significant effect of social and relationship capital disclosure on business model (
B = .593,
P = .000) is found. Nonetheless, a positive and significant effect is noted between social and relationship capital disclosure and business model for JSE listed companies (
B = .693,
P = .000). This is the indirect effect path
‘a’. Thus, the models are stated as;
4.4.3. Step 3: Testing for the Indirect Effect Path ‘b’ and Direct Effect ‘c1’
Multiple regression analysis was conducted taking social and relationship capital disclosure and business model as predictors of firm value. The idea was to unravel how firm value was predicted by social and relationship capital disclosure and business model. This was aimed at gauging the direct effect path ‘c1’ and the indirect effect path ‘b’, to accomplish condition 3 of mediation analysis. The comparative regression model summary, ANOVA and coefficients between Kenya and South African listed companies data were as presented below.
(i). Model Summary of Social and Relationship Capital Disclosure, Business Model and Firm Value
A multiple regression was run comprising social and relationship capital disclosure and business model as predictors to interrogate their effect on firm value.
Table 14 depicts the summary.
Table 14. Model summary of social and relationship capital disclosure, business model and firm value.
COUNTRY | Model | R | R Square | Adjusted R Square | Std. Error of the Estimate |
Kenya | 1 | .612a | .374 | .350 | .47114 |
South Africa | 1 | .217a | .047 | .041 | .47266 |
a. Predictors: (Constant), BMD, SRCD
Source: Research data, 2024
Table 14 shows that social and relationship capital disclosure and business model as predictors explain the variation in value of NSE listed firms to the extent of 37.4% (
R2 = .374) and therefore, 62.6% of the variation can be explained by other factors not contained in the model. While, for JSE listed firms 4.7% (
R2 = .047) is explicated, indicating that 95.3% is expounded by other factors.
(ii). ANOVA of Social and Relationship Capital Disclosure, Business model And Firm Value
ANOVA was deployed in order to ascertain how fit the models were in predicting the link between social and relationship capital disclosure, business model and firm value between Kenya and South Africa. The results are as portrayed in
Table 15 below.
Table 15. ANOVA of social and relationship capital disclosure, business model and firm value.
COUNTRY | Model | Sum of Squares | df | Mean Square | F | Sig. |
Kenya | 1 | Regression | 6.769 | 2 | 3.384 | 15.246 | .000b |
Residual | 11.321 | 51 | .222 | | |
Total | 18.089 | 53 | | | |
South Africa | 1 | Regression | 3.484 | 2 | 1.742 | 7.797 | .000b |
Residual | 70.372 | 315 | .223 | | |
Total | 73.856 | 317 | | | |
a. Dependent Variable: FV
b. Predictors: (Constant), BMD, SRCD
Source: Research data, 2024
The ANOVA results as presented in
Table 15 indicate (
F (2,51) = 15.246,
P =.000) reported for Kenya. Then again, (
F (2,315) = 7.797,
P =.000) is depicted for South Africa. This verifies the suitability of the model in the prediction of the relation between social and relationship capital, business model and value of NSE and JSE listed firms.
(iii). Regression Coefficient to Predict Firm Value from Social and Relationship Capital Disclosure and Business Model
To determine how a unit variation in social and relationship capital disclosure affect the business model of listed firms in NSE and JSE the researcher conducted multiple regression analysis. The study findings are as displayed in
Table 16 below.
Table 16. Regression coefficients to predict firm value from social and relationship capital disclosure and mediating variable business model (Direct effect ‘c1’ and Indirect effect ‘b’).
COUNTRY | Model | Unstandardized Coefficients | Standardized Coefficients | t | Sig. |
B | Std. Error | Beta |
Kenya | 1 | (Constant) | .773 | .327 | | 2.360 | .022 |
SRCD | .959 | .175 | .744 | 5.492 | .000 |
BMD | -.617 | .170 | -.493 | -3.636 | .001 |
South Africa | 1 | (Constant) | .353 | .202 | | 1.745 | .082 |
SRCD | .162 | .109 | .099 | 1.495 | .136 |
BMD | .192 | .088 | .145 | 2.185 | .030 |
a. Dependent Variable: FV
Source: Research data, 2024
From the findings in
Table 16 it can be deduced that all factors remaining constant, firm value of NSE listed firms is .773. Whereas, the direct effect ‘
c1’ signify a change in social and relationship capital disclosure by one unit would significantly cause a positive change in the value of the firm (
B = .959,
P = .000). While, the indirect path
‘b’, show that changing the business model disclosure by one unit negatively and significantly influence the value of the firm (
B =-.617,
P = .001).
Inversely, containing all else constant, the value of listed firms in JSE is .353. The direct effect ‘c1’ is elucidated as changing social and relationship capital disclosure by one unit causes a positive and non-significant change in value of the firm (B = .162, P = .136). While, a change in business model disclosure by one unit positively and significantly influence the value of the firm (B = .192, P = .030). This represents the indirect path ‘b’. The established models are;
FVk = .773 +.959SRCDk -.617BMDk + e
FVs = .353 +.162SRCDs +.192BMDs + e
Step 4: Determination of existence and nature of mediation -Kenya
On the basis of unstandardized beta coefficients of
direct effect ‘
c1’ and total effect
‘c’ existence of mediation was assessed. While the nature of mediation was assessed by examining the significance of the direct and indirect effects. On grounds of the three regression models above,
Figure 3 and
Table 17 below summarizes the unstandardized coefficients of the total, direct and indirect effects.
Figure 3. Mediation effect of business model in the association between social and relationship capital disclosure and firm value for Kenya.
Table 17. The path unstandardized regression coefficient and its significance –Kenya.
Construct | Path | Construct | Standardized Estimate | P-Value | Result |
Total Effects |
Firm Value | - | Social and relationship capital disclosure | .593 | .000 | Significant |
Direct and Indirect effects |
Firm Value | - | Social and relationship capital disclosure | .959 | .000 | Significant |
Business model disclosure | - | Social and relationship capital disclosure | .593 | .000 | Significant |
Firm Value | - | Business model disclosure | -.617 | .001 | Significant |
Source: Research data, 2024
Regression analysis was applied to examine whether business model mediated the relationship between social and relationship capital disclosure and value of firms listed in the NSE. In which,
Table 17 and
figure 3 explain that the total effect ‘
c’ was positive and significant (
B =.593,
P = .000). With the addition of the mediating variable business model, the direct effect ‘
c1’ of social and relationship capital disclosure on firm value increased and was significant (
B = .959,
P = .000).
Social and relationship capital disclosure was positively and significantly associated with business model (B = .593, P = .000), the path ‘a’. While, a negative and significant effect between business model and firm value (β = -.617, P = .001), path ‘b’ was confirmed. The product of the indirect effects ‘ab’ (a*b = .593 * -.617) resulted to a value of -.3658. The proportion mediated was about 62% (ab/c = -.3658/.593). A comparison of the direct versus indirect paths (c1 = .959 and ab = -.3658) proposed that c1 > ab in absolute value denoting .381 (-.3658/.959) mediation ratio. As, c1>c and the indirect effect ‘ab’ is opposite in sign compared to ‘c1’, inconsistent mediation is inferred.
To assess the extent to which social and relationship capital disclosure influenced firm through the business model, R2med was calculated to establish the effect-size of mediation. This resulted to R2med value of -.159. Negative R2med predicts occurrence of suppression effect. The overall R2med value of -.159 show that about 16% of the variance in the value of the firm is attributable to the indirect effects of social and relationship capital disclosure through the business model. Taking into account that relatively 37% of the total variance in firm value is explained (R2multiple = .374), out of this around 43% (-.159/.374) of the explained variance in the model was due to the mediated effect.
4.4.4. Testing the Indirect Path (ab) Significance of Mediation Analysis-Kenya
Following Hayes
| [18] | Hayes, A. F. (2013). Introduction to Mediation, Moderation, and Conditional Process Analysis: A Regression-Based Approach, (1st ed. pp. 34-40). London & New York: Guilford Press. |
[18]
Macro process via bootstrapping method, the presence and significance of mediation if any, was tested. The bootstrap was set at 5000 samples, with a bias corrected confidence level of 95%. The results are as provided in
Table 18 below.
Table 18. Bootstrapping mediation analysis summary.
Relationship | Direct Effect | Indirect Effect | Confidence Interval | P-value | Conclusion |
Lower Bound | Upper Bound |
Social and relationship capital disclosure - Business model- Firm value | .9588 (.0000) | -.3659 | -.6799 | -.1499 | <.05 | Inconsistent Mediation |
Source: Research data, 2024
As demonstrated in
Table 18, the bootstrap conducted indicates that the direct effect is positive and statistically significant (
B = .9588,
P = .0000). The confidence intervals of lower bound and upper bound (
LLCI = -.6799,
ULCI = -.1499) excluded zero. Therefore, the indirect effect was statistically significant. Because both the indirect and direct effect were statistically significant after considering the mediator into the relationship, the study concludes that mediation exists. However, by virtue of the direct and indirect hold opposite signs, inconsistent mediation is proclaimed.
Step 4: Determination of existence and nature of mediation -South Africa.
Following the analysis conducted on the three regression models above,
Figure 4 and
Table 19 summarizes the unstandardized coefficients of the total, direct and indirect effect.
Figure 4. Mediation effect of business model in the association between social and relationship capital disclosure and firm value for South Africa.
Table 19. The path unstandardized regression coefficient and its significance -South Africa.
Construct | Path | Construct | Unstandardized Estimate | P-Value | Result |
Total Effects |
Firm Value | - | Social and relationship capital disclosure | .296 | .001 | Significant |
Direct and Indirect effects |
Firm Value | - | Social and relationship capital disclosure | .162 | .136 | Not Significant |
Business model disclosure | - | Social and relationship capital disclosure | .693 | .000 | Significant |
Firm Value | - | Business model disclosure | .192 | .030 | Significant |
Source: Research data, 2024
Regression analysis was put into use to unravel the mediating role of the business model in the association between social and relationship capital disclosure and value of firms listed in the JSE. The findings unveil that the total effect ‘c’ of social and relationship capital disclosure on firm value was positive and significant (B= .296, P =.001). With the insertion of the mediating variable business model, the direct effect ‘c1’ of social and relationship capital disclosure on firm value decreased and became non-significant (B = .162, P = .136). Social and relationship capital disclosure was found to be positively and significantly connected to business model (B = .693, P = .000). This represents the indirect effect path ‘a’. Additionally, the indirect effect path ‘b’ comprising the relation between business model and firm value was positive and significant (B = .192, P = .030). The associated indirect effects ‘ab’ was .1331 (a*b = .693*.192). The proportion mediated is about 45% (.1331/.296). Contrasting of the direct versus indirect paths (c1 = .162 and ab .1331) imply that c1 > ab and the resultant mediation ratio is relatively .822 (ab/c1 = .1331/.162). Thus, by the direct effect reporting non-significant results on controlling for the mediator and the indirect effect paths ‘a’ and ‘b’ being both significant, it can be concluded that the business model mediates the relationship between social and relationship capital disclosure and value of firms listed in the JSE. This construed as complete/full mediation.
To estimate the magnitude of the indirect effect-size of social and relationship capital disclosure on firm value through the business model, R2med was calculated. The computed R2med value is .026. The overall R2med value of .026 propose that approximately 3% of the variance in the value of the firm is attributable to the indirect effects of social and relationship capital disclosure through the business model. Taking into account that relatively 4.7 % of the total variance in firm value is explained (R2multiple = .047), out of this about 55% (.026/.047) of the explained variance in the model was due to the mediated effect.
Testing the indirect path (ab) significance of mediation analysis for South Africa.
Following Hayes
| [18] | Hayes, A. F. (2013). Introduction to Mediation, Moderation, and Conditional Process Analysis: A Regression-Based Approach, (1st ed. pp. 34-40). London & New York: Guilford Press. |
[18]
Macro process via bootstrapping method, the presence and significance of mediation if any, was tested. The bootstrap was set at 5000 samples, with a bias corrected confidence level of 95%. The results are as provided in
Table 20 below.
Table 20. Bootstrapping mediation analysis summary-South Africa.
Relationship | Direct Effect | Indirect Effect | Confidence Interval | P-value | Conclusion |
Lower Bound | Upper Bound |
Social & relationship capital disclosure - Business model- Firm value | .1625 (.1358) | .1333 | .0332 | .2474 | <.05 | Complete/full Mediation |
Source: Research data, 2024
As demonstrated in
Table 20, the bootstrap conducted indicates that the direct effect is not statistically significant (B =.1625,
P = .1358). On examining the confidence intervals of lower bound and upper bound (LLCI = .0332, ULCI = .2474), a zero was excluded from the range. This attests a statistically significant indirect effect. The direct effect was not statistically significant on inserting the mediator into the relationship. Complete/full mediation is confirmed.