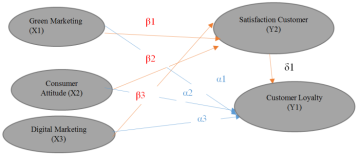
The purpose of this study was to determine the variables that make customers feel satisfied and loyal to Local Franchise Restaurants in Indonesia. The variables studied were Green Marketing, Consumer Attitude, Digital Marketing, Customer Loyalty and Customer Satisfaction as an Intervening Variable. The sample of this study was 110 respondents. The quantitative research method used SEM AMOS. From the results of the analysis of this study, it appears that this study supports the theory or research results which state that Green Marketing, Positive Customer Attitudes and Digital Marketing have an effect on Customer Loyalty. And Local Franchise Restaurant Customers have the same Satisfaction and Loyalty Standards as Foreign Franchise Restaurant Customers, namely considering Green Marketing, Customer Attitudes and Digital Marketing. The results of the study are as follows a) that Green Marketing is a consideration of Customer Satisfaction Customers. b) the Customer Attitude variable affects the customer satisfaction variable. In order for Customer Attitude to be positive, Restaurant employees must be quick in responding to customer needs or requests. Waiters are sensitive to customer needs and desires and when finished saying thank you, can provide satisfaction to customers. c) the Digital Marketing variable affects the customer satisfaction variable. Promotion with Digital Marketing makes it very easy for customers to buy food products by utilizing technological advances. d) the Green Marketing variable affects the customer loyalty variable. Customers already understand the importance of Green Marketing in managing a business. e) the Customer Attitude variable affects the customer loyalty variable. Management and employees must be able to perform well so that their customers are loyal to repurchase the company's products, buy various new products and recommend to others. f) the Digital Marketing variable affects the customer loyalty variable. Digital Marketing is improved to be able to attract loyal customers. g) the customer satisfaction variable affects customer loyalty. Customer satisfaction will make customers loyal to it. h) the Green Marketing variable indirectly affects customer loyalty. Green Marketing affects customer loyalty through customer satisfaction with Restaurant products. i) the Customer Attitude variable indirectly affects customer loyalty through customer satisfaction, on restaurant products. j) the Digital Marketing variable indirectly affects customer loyalty through customer satisfaction with restaurant products.
| Published in | International Journal of Economics, Finance and Management Sciences (Volume 12, Issue 6) |
| DOI | 10.11648/j.ijefm.20241206.27 |
| Page(s) | 554-562 |
| Creative Commons |
This is an Open Access article, distributed under the terms of the Creative Commons Attribution 4.0 International License (http://creativecommons.org/licenses/by/4.0/), which permits unrestricted use, distribution and reproduction in any medium or format, provided the original work is properly cited. |
| Copyright |
Copyright © The Author(s), 2024. Published by Science Publishing Group |
Green Marketing, Consumer Attitude, Digital Marketing, Customer Loyalty, Customer Satisfaction
Questionnaire No. | count | r table | Information |
|---|---|---|---|
GM1 | 0.719 | 0.1946 | Legitimate |
GM2 | 0.575 years | 0.1946 | Legitimate |
English: GM3 | 0.588 | 0.1946 | Legitimate |
English: GM4 | 0.452 | 0.1946 | Legitimate |
English: GM5 | 0.497 | 0.1946 | Legitimate |
English: GM6 | 0.631 | 0.1946 | Legitimate |
Cronbach's Alpha | N of Items |
|---|---|
,656 | 4 |
Questionnaire No. | count | r table | Information |
|---|---|---|---|
English: SP1 | 0.592 | 0.1946 | Legitimate |
SP2 | 0.458 | 0.1946 | Legitimate |
SP3 | 0.449 | 0.1946 | Legitimate |
SP4 | 0.514 | 0.1946 | Legitimate |
Cronbach's Alpha | N of Items |
|---|---|
,650 | 4 |
Questionnaire No. | count | r table | Information |
|---|---|---|---|
DM1 | 0.487 | 0.1946 | Legitimate |
DG2 | 0.284 | 0.1946 | Legitimate |
DM3 | 0.412 | 0.1946 | Legitimate |
DM4 | 0.487 | 0.1946 | Legitimate |
DM5 | 0.433 | 0.1946 | Legitimate |
DM6 | 0.611 | 0.1946 | Legitimate |
Cronbach's Alpha | N of Items |
|---|---|
,725 | 6 |
Questionnaire No. | count | r table | Information |
|---|---|---|---|
KP1 | 0.532 | 0.1946 | Legitimate |
KP2 | 0.616 | 0.1946 | Legitimate |
KP3 | 0.581 years | 0.1946 | Legitimate |
KP4 | 0.595 | 0.1946 | Legitimate |
KP5 | 0.537 years | 0.1946 | Legitimate |
KP6 | 0.709 | 0.1946 | Legitimate |
Cronbach's Alpha | N of Items |
|---|---|
,635 | 6 |
Questionnaire No. | count | r table | Information |
|---|---|---|---|
LP1 | 0.471 | 0.1946 | Legitimate |
LP2 | 0.661 | 0.1946 | Legitimate |
LP3 | 0.566 years | 0.1946 | Legitimate |
LP4 | 0.629 | 0.1946 | Legitimate |
LP5 | 0.510 | 0.1946 | Legitimate |
LP6 | 0.763 | 0.1946 | Legitimate |
Cronbach's Alpha | N of Items |
|---|---|
,653 | 6 |
Ha | Model | Estimating | English | P Value | Decision |
|---|---|---|---|---|---|
1 | Green Marketing→Customer Satisfaction | 0.641 | 2.240 | 0.015 | Ha1 accepted |
2 | Consumer Attitude→Customer Satisfaction | 0.020 | 3,237 people | 0.001 | Ha2 accepted |
3 | Digital Marketing→Customer Satisfaction | 0.122 | 2,176 people | 0.030 | Ha3 accepted |
4 | Green Marketing→Customer Loyalty | 0.419 | 2,966 people | 0.009 | Ha4 accepted |
5 | Consumer Attitude→Customer Loyalty | 0.016 | 3,993 people | 0.000 | Ha5 accepted |
6 | Digital Marketing→Customer Loyalty | 0.065 years | 2,524 people | 0.011 | Ha6 accepted |
7 | Customer satisfaction→Customer loyalty | 0.138 | 3,083 people | 0.000 | Ha7 accepted |
Product Quality | Quality of Service | Price | Customer satisfaction | Customer Loyalty | |
|---|---|---|---|---|---|
Customer satisfaction | ,000 | ,000 | ,000 | ,000 | ,000 |
Customer Loyalty | ,081 | ,006 | ,170 | ,000 | ,000 |
Product Quality | Quality of Service | Price | Customer satisfaction | Customer Loyalty | |
|---|---|---|---|---|---|
Customer satisfaction | ,318 | ,025 | ,670 | ,000 | ,000 |
Customer Loyalty | ,233 | ,029 | ,145 | ,254 | ,000 |
| [1] | Dewi, Santi Rahma. 2016. Understanding and Concern for the Implementation of Green Accounting: Case Study of Tofu SMEs in Sidoarjo. Prociding of the National Economic and Business Seminar & Call For Paper Feb Umsida. 497-511. |
| [2] | Dyah Eko Setyowati, Sri Kartika Sari Antariksa, Yani Antariksa. 2021. Metode Penelitian Manajemen (Management Research Methods). Jakad Media Publishing. |
| [3] | Mutaminah and Siyatimah. 2012. Green Business Development Model for Improving Financial Performance and Market Performance, Proceedings of the Indonesian Management Forum (FMI). Yogyakarta. |
| [4] | Rahayu LMP, Abdillah Y, Mawardi MK. 2017. The Influence of Green Marketing on Consumer Purchasing Decisions (Survey on The Body Shop Consumers in Indonesia and Malaysia). Journal of Business Administration. 43(1): 121-131. |
| [5] | Santoso I, Fitriyani R. 2016. Green Packaging, Green Product, Green Advertising, Perception, and Consumer Purchase Interest. Journal of Family and Consumer Sciences. 9(2): 147–158. |
| [6] | Utami KS. 2020. Green Consumers Behavior: Consumer Behavior in Purchasing Environmentally Friendly Products. Jurnal Maksipreneur 9(2): 209-224. |
| [7] | DE Setyowati. 2024. Sustainable Marketing Practices: Balancing Profitability and Social Responsibility in Modern Business. The Journal of Academic Science 1(6): 611-619. |
| [8] | FH, Dyah Eko Setyowati. 2024. Analysis of Relationship Marketing Lifestyle Consumer Attitudes on Purchasing Business and their impact on Loyalty for MSME Products Made from Sea Production in Sidoarjo Regency. Global International Journal of Innovative Research 2(6): 111-112. |
| [9] | MA Khomsin. 2023. The Influence of Green Marketing Knowledge Product Innovation on Purchase Interest and Purchase Decision. Journal of Digital Business and Marketing. Vol 3 No 1 July 2023. |
| [10] | S Fatimah, Y Chirsmardani. 2022. The Influence of Green Marketing on Customer Loyalty Through Customer Satisfaction at Starbucks Coffee in Makasar City. Journal of Applied Business & Economics. Vol 9, Issue 1. P 1. |
| [11] | Tjan, Shelly Beauty 2024. The Influence of Green Marketing and Consumer Awareness on Purchase Decisions in the Fast Moving Consumer Goods Industry. Journal of Management and Creative Economy. Vol 2 No 3, July. 2024. |
| [12] | Setyowati, Hambalah. 2024. Analysis of Relationship Marketing Lifestyle Consumer Attitudes on Purchasing Decisions and their Impact on Loyalty for MSME Products Made from Sea Products in Sidoarjo Regency. IJAIR, Vol 8 No. 1.1. |
| [13] | Setyowati. DE. 2024. Sustainable Marketing Practices. Balancing Profitability and Sosial Responsibility in Modern Business. The Journal of Academic Science Volume 6. |
| [14] | Primadona, Dyah Eko, Mustajab, Dyah Hapsari, Taufan. 2023. The Ghost of Disruption: Preventing Business Death with Organizational Culture and Engaging Artificial Intelligence. International Journal of Artificial Intelligence Research. Volume 6. |
| [15] | Asyhari, Sitty Yuwalliatin. 2021. The Influence Of Green Marketing Strategy On Purchasing Decision With Mediation Role Of Brand Image. Journal Management Aplication. Vol 19. No 3. |
| [16] | Antariksa, Sri Kartika Sari. 2020. Integrated Service Quality Analysis Towards Performance of Employee Agency Integrated One Door Services (BPTSP) in DKI Jakarta With Customer Satisfaction as an Intervening Variable. ICMAE 2020. Antlantis Press. |
APA Style
Setyowati, D. E., Antariksa, S. K. S. (2024). Analysis of the Influence of Green Marketing, Consumer Attitudes, Digital Marketing on Customer Loyalty with Customer Satisfaction as an Intervening Variable. International Journal of Economics, Finance and Management Sciences, 12(6), 554-562. https://doi.org/10.11648/j.ijefm.20241206.27
ACS Style
Setyowati, D. E.; Antariksa, S. K. S. Analysis of the Influence of Green Marketing, Consumer Attitudes, Digital Marketing on Customer Loyalty with Customer Satisfaction as an Intervening Variable. Int. J. Econ. Finance Manag. Sci. 2024, 12(6), 554-562. doi: 10.11648/j.ijefm.20241206.27
AMA Style
Setyowati DE, Antariksa SKS. Analysis of the Influence of Green Marketing, Consumer Attitudes, Digital Marketing on Customer Loyalty with Customer Satisfaction as an Intervening Variable. Int J Econ Finance Manag Sci. 2024;12(6):554-562. doi: 10.11648/j.ijefm.20241206.27
@article{10.11648/j.ijefm.20241206.27,
  author = {Dyah Eko Setyowati and Sri Kartika Sari Antariksa},
  title = {Analysis of the Influence of Green Marketing, Consumer Attitudes, Digital Marketing on Customer Loyalty with Customer Satisfaction as an Intervening Variable
},
  journal = {International Journal of Economics, Finance and Management Sciences},
  volume = {12},
  number = {6},
  pages = {554-562},
  doi = {10.11648/j.ijefm.20241206.27},
  url = {https://doi.org/10.11648/j.ijefm.20241206.27},
  eprint = {https://article.sciencepublishinggroup.com/pdf/10.11648.j.ijefm.20241206.27},
  abstract = {The purpose of this study was to determine the variables that make customers feel satisfied and loyal to Local Franchise Restaurants in Indonesia. The variables studied were Green Marketing, Consumer Attitude, Digital Marketing, Customer Loyalty and Customer Satisfaction as an Intervening Variable. The sample of this study was 110 respondents. The quantitative research method used SEM AMOS. From the results of the analysis of this study, it appears that this study supports the theory or research results which state that Green Marketing, Positive Customer Attitudes and Digital Marketing have an effect on Customer Loyalty. And Local Franchise Restaurant Customers have the same Satisfaction and Loyalty Standards as Foreign Franchise Restaurant Customers, namely considering Green Marketing, Customer Attitudes and Digital Marketing. The results of the study are as follows a) that Green Marketing is a consideration of Customer Satisfaction Customers. b) the Customer Attitude variable affects the customer satisfaction variable. In order for Customer Attitude to be positive, Restaurant employees must be quick in responding to customer needs or requests. Waiters are sensitive to customer needs and desires and when finished saying thank you, can provide satisfaction to customers. c) the Digital Marketing variable affects the customer satisfaction variable. Promotion with Digital Marketing makes it very easy for customers to buy food products by utilizing technological advances. d) the Green Marketing variable affects the customer loyalty variable. Customers already understand the importance of Green Marketing in managing a business. e) the Customer Attitude variable affects the customer loyalty variable. Management and employees must be able to perform well so that their customers are loyal to repurchase the company's products, buy various new products and recommend to others. f) the Digital Marketing variable affects the customer loyalty variable. Digital Marketing is improved to be able to attract loyal customers. g) the customer satisfaction variable affects customer loyalty. Customer satisfaction will make customers loyal to it. h) the Green Marketing variable indirectly affects customer loyalty. Green Marketing affects customer loyalty through customer satisfaction with Restaurant products. i) the Customer Attitude variable indirectly affects customer loyalty through customer satisfaction, on restaurant products. j) the Digital Marketing variable indirectly affects customer loyalty through customer satisfaction with restaurant products.
},
 year = {2024}
}
TY  - JOUR
T1  - Analysis of the Influence of Green Marketing, Consumer Attitudes, Digital Marketing on Customer Loyalty with Customer Satisfaction as an Intervening Variable

AU  - Dyah Eko Setyowati
AU  - Sri Kartika Sari Antariksa
Y1  - 2024/12/27
PY  - 2024
N1  - https://doi.org/10.11648/j.ijefm.20241206.27
DO  - 10.11648/j.ijefm.20241206.27
T2  - International Journal of Economics, Finance and Management Sciences
JF  - International Journal of Economics, Finance and Management Sciences
JO  - International Journal of Economics, Finance and Management Sciences
SP  - 554
EP  - 562
PB  - Science Publishing Group
SN  - 2326-9561
UR  - https://doi.org/10.11648/j.ijefm.20241206.27
AB  - The purpose of this study was to determine the variables that make customers feel satisfied and loyal to Local Franchise Restaurants in Indonesia. The variables studied were Green Marketing, Consumer Attitude, Digital Marketing, Customer Loyalty and Customer Satisfaction as an Intervening Variable. The sample of this study was 110 respondents. The quantitative research method used SEM AMOS. From the results of the analysis of this study, it appears that this study supports the theory or research results which state that Green Marketing, Positive Customer Attitudes and Digital Marketing have an effect on Customer Loyalty. And Local Franchise Restaurant Customers have the same Satisfaction and Loyalty Standards as Foreign Franchise Restaurant Customers, namely considering Green Marketing, Customer Attitudes and Digital Marketing. The results of the study are as follows a) that Green Marketing is a consideration of Customer Satisfaction Customers. b) the Customer Attitude variable affects the customer satisfaction variable. In order for Customer Attitude to be positive, Restaurant employees must be quick in responding to customer needs or requests. Waiters are sensitive to customer needs and desires and when finished saying thank you, can provide satisfaction to customers. c) the Digital Marketing variable affects the customer satisfaction variable. Promotion with Digital Marketing makes it very easy for customers to buy food products by utilizing technological advances. d) the Green Marketing variable affects the customer loyalty variable. Customers already understand the importance of Green Marketing in managing a business. e) the Customer Attitude variable affects the customer loyalty variable. Management and employees must be able to perform well so that their customers are loyal to repurchase the company's products, buy various new products and recommend to others. f) the Digital Marketing variable affects the customer loyalty variable. Digital Marketing is improved to be able to attract loyal customers. g) the customer satisfaction variable affects customer loyalty. Customer satisfaction will make customers loyal to it. h) the Green Marketing variable indirectly affects customer loyalty. Green Marketing affects customer loyalty through customer satisfaction with Restaurant products. i) the Customer Attitude variable indirectly affects customer loyalty through customer satisfaction, on restaurant products. j) the Digital Marketing variable indirectly affects customer loyalty through customer satisfaction with restaurant products.

VL  - 12
IS  - 6
ER  -
Faculty of Social and Political Sciences, Hang Tuah University, Surabaya, Indonesia
Faculty of Management Economics, Indonesian Business College (STIE Bisnis Indonesia), Jakarta, Indonesia
Information