Noise pollution is a concerning issue in Bangladesh due to its impact on human health. It is increasing in Laxmipur District Town in recent years due to the introduction of a number of different vehicles. Some vehicles, particularly rickshaws and auto-rickshaws, may use outdated mechanical horns, exacerbating the noise, the use of heavy machinery for construction, and the unregulated use of loudspeakers in social, religious, and political events and public announcements. The current study has been carried out to assess the extent of noise pollution in various areas of Laxmipur District Town. 7 different zones, along with 45 locations, were selected in Laxmipur District Town based on land use. A sound level meter (REED SD-4023) was used to monitor noise levels in Laxmipur District Town from January 01, 2021, to April 30, 2021. At each sampling location, several samples were collected. Three times a day, we have measured the noise level in every location. The mean noise pollution level and Leq of Laxmipur District Town were determined to be 68.78 dBA and 92.46 dBA, respectively. The measured mean and Leq values were 69.11 dBA and 89.00 dBA for silent areas, 67.76 dBA and 79.34 dBA for residential areas, 76.75 dBA and 82.32 dBA for mixed areas, 70.90 dBA and 81.07 dBA for commercial areas, 67.57 dBA and 95.70 dBA for industrial areas, 74.28 dBA and 87.29 dBA for road intersections, and 64.49 dBA and 75.40 dBA for village areas, respectively. The hierarchy in different land uses based on mean noise level was Mixed Areas > Road Intersection > Commercial Area > Silent Area > Residential Area > Industrial Area > Village Area. The three highest noise-polluted areas were Rehana Food (105.62 dBA), Titakha Mosjid-2 (98.49 dBA), and Dalal Bazar (96.75 dBA), whereas the three lowest noise-polluted areas were Vumi Office (58.51 dBA), Banchan Nogor (61.38 dBA), and Hi Food (66.19 dBA), based on Leq. However, a study found that every sample location's noise level exceeded the national guideline.
| Published in | International Journal of Environmental Monitoring and Analysis (Volume 13, Issue 2) |
| DOI | 10.11648/j.ijema.20251302.12 |
| Page(s) | 61-73 |
| Creative Commons |
This is an Open Access article, distributed under the terms of the Creative Commons Attribution 4.0 International License (http://creativecommons.org/licenses/by/4.0/), which permits unrestricted use, distribution and reproduction in any medium or format, provided the original work is properly cited. |
| Copyright |
Copyright © The Author(s), 2025. Published by Science Publishing Group |
Noise Pollution, Land Use, Dispersion, Cluster, Laxmipur District Town, Bangladesh
Land Use (N) | Mean | Minimum | Maximum | Standard Deviation | Range | Median | Rank |
|---|---|---|---|---|---|---|---|
Silent Area (10) | 69.11 | 40.70 | 121.20 | 12.11 | 80.50 | 67.80 | 4 |
Residential Area (3) | 67.76 | 42.30 | 101.10 | 10.14 | 58.80 | 67.30 | 5 |
Mixed Areas (2) | 76.75 | 61.70 | 99.20 | 6.31 | 37.50 | 76.20 | 1 |
Commercial Area (8) | 70.90 | 49.40 | 104.20 | 8.93 | 54.80 | 70.10 | 3 |
Industrial Area (9) | 67.57 | 38.70 | 127.50 | 9.32 | 88.80 | 67.40 | 6 |
Road Intersection (4) | 74.28 | 48.90 | 112.70 | 8.19 | 63.80 | 73.40 | 2 |
Village Area (9) | 64.49 | 39.60 | 121.20 | 9.45 | 81.60 | 64.20 | 7 |
Mean (45) | 68.78 | 38.70 | 127.50 | 10.35 | 88.80 | 68.40 | - |
(I) Land Use | (J) Land Use | Mean Difference (I-J) | Standard Error | Sig. |
|---|---|---|---|---|
Silent Area | Residential Area | 1.3514* | 0.50538 | 0 |
Mixed Areas | -7.6376* | 0.31107 | 0.007 | |
Commercial Area | -1.7854* | 0.36438 | 0 | |
Industrial Area | 1.5447* | 0.284 | 0 | |
Road Intersection | -5.1681* | 0.30863 | 0 | |
Village Area | 4.6172* | 0.47997 | 0 | |
Residential Area | Silent Area | -1.3514* | 0.50538 | 0 |
Mixed Areas | -8.9890* | 0.513 | 0 | |
Commercial Area | -3.1367* | 0.54697 | 0.55 | |
Industrial Area | 0.1933 | 0.49705 | 0 | |
Road Intersection | -6.5195* | 0.51152 | 0.206 | |
Village Area | 3.2659* | 0.6299 | 0.019 | |
Mixed Areas | Silent Area | 7.6376* | 0.31107 | 0.007 |
Residential Area | 8.9890* | 0.513 | 0 | |
Commercial Area | 5.8522* | 0.37487 | 0 | |
Industrial Area | 9.1823* | 0.29734 | 0 | |
Road Intersection | 2.4695* | 0.32095 | 0 | |
Village Area | 12.2549* | 0.48798 | 0 | |
Commercial Area | Silent Area | 1.7854* | 0.36438 | 0 |
Residential Area | 3.1367* | 0.54697 | 0.55 | |
Mixed Areas | -5.8522* | 0.37487 | 0 | |
Industrial Area | 3.3300* | 0.35273 | 0 | |
Road Intersection | -3.3827* | 0.37285 | 0.009 | |
Village Area | 6.4026* | 0.52357 | 0.001 | |
Industrial Area | Silent Area | -1.5447* | 0.284 | 0 |
Residential Area | -0.1933 | 0.49705 | 0 | |
Mixed Areas | -9.1823* | 0.29734 | 0 | |
Commercial Area | -3.3300* | 0.35273 | 0 | |
Road Intersection | -6.7128* | 0.29479 | 0 | |
Village Area | 3.0726* | 0.47119 | 0 | |
Road Intersection | Silent Area | 5.1681* | 0.30863 | 0 |
Residential Area | 6.5195* | 0.51152 | 0.206 | |
Mixed Areas | -2.4695* | 0.32095 | 0 | |
Commercial Area | 3.3827* | 0.37285 | 0.009 | |
Industrial Area | 6.7128* | 0.29479 | 0 | |
Village Area | 9.7854* | 0.48643 | 0.089 | |
Village Area | Silent Area | -4.6172* | 0.47997 | 0 |
Residential Area | -3.2659* | 0.6299 | 0.019 | |
Mixed Areas | -12.2549* | 0.48798 | 0 | |
Commercial Area | -6.4026* | 0.52357 | 0.001 | |
Industrial Area | -3.0726* | 0.47119 | 0 | |
Road Intersection | -9.7854* | 0.48643 | 0.089 | |
Based on observed means. The error term is Mean Square (Error) = 99.403. * The mean difference is significant at the 0. | ||||
Land Use (N) | Location | Standard Value | Within Standard (%) |
|---|---|---|---|
Silent Area (10) | Ansar Camp | 50 | 0.00% |
Dalal Bazar Digree College | 0.00% | ||
Dalal Bazar Govt. Primary Girls School | 11.25% | ||
Dalal Bazar Primary School | 0.00% | ||
Department of Forest | 0.00% | ||
Laxmipur Govt. Mohila College | 0.00% | ||
Moddho Banchannogor Primary School | 0.33% | ||
Samsundor Mondir | 0.00% | ||
Titakha Mosjid-1 | 25.00% | ||
Titakha Mosjid-2 | 0.00% | ||
Mean | 3.66% | ||
Residential Area (3) | Master Road | 55 | 0.00% |
Mia Bari Abasik | 47.62% | ||
Shakhari Para | 21.97% | ||
Mean | 23.20% | ||
Mixed Areas (2) | Bagbari | 60 | 0.00% |
College Road | 6.00% | ||
Mean | 3.00% | ||
Commercial Area (8) | Dalal Bazar -1 | 70 | 4.04% |
Fire Service | 88.08% | ||
Raypur, Dalal Bazar | 21.57% | ||
Sornokar Road | 43.95% | ||
TaTa Service Centre | 55.23% | ||
Temuhoni CNG Station | 55.10% | ||
Thana Road | 43.95% | ||
Vumi Office | 70.82% | ||
Mean | 47.84% | ||
Industrial Area (9) | Chowdhury Auto Rice | 75 | 59.02% |
Hi Food | 95.51% | ||
Meghnar Par MBM Brick Field | 98.30% | ||
Mobile Factory | 82.85% | ||
Plastic Scrap Factory | 75.08% | ||
Quality Agro Industry | 49.28% | ||
Raihan Industry | 94.44% | ||
Rehana food | 73.46% | ||
Sultanita Bekari | 80.00% | ||
Mean | 78.66% | ||
All Mean | 26.63% | ||
AC | Alternating Current |
CA | Commercial Area |
CAPS | Center for Atmospheric Pollution Studies |
CNG | Compressed Natural Gas |
dBA | A-weighted Decibel |
DoE | Department of Environment |
GB | Gigabyte |
GIS | Geographic Information System |
Govt. | Government |
IA | Industrial Area |
Leq | Equivalent Continuous Sound Pressure Level |
Ltd | Limited |
MA | Mixed Areas |
MAX | Maximum |
MBM | Madina Bricks Manufacturing |
MIN | Minimum |
N | Number (in Terms of Quantity) |
NIHL | Noise-Induced Hearing Loss |
PC | Personal Computer |
RA | Residential Area |
REC | Record |
RIS | Road Intersections |
SA | Silent Area |
SD | Secure Digital |
Sig | Significant |
SPSS | Statistical Package for the Social Sciences |
VA | Village Area |
WHO | World Health Organization |
| [1] | Islam Z, Abdullah F, Khanom M. Evaluation of traffic accessibility condition and noise pollution in Dhaka City of Bangladesh. American Journal of Traffic and Transportation Engineering. 2021; 6(2): 43-51. |
| [2] | Rao PR, Rao MGS. Community Reaction to Road Traffic Noise. Applied Acoustics. 1992; 37: 51-64. |
| [3] | United Nations Environment Programme (UNEP). Frontiers 2022: Noise, Blazes and Mismatches – Emerging Issues of Environmental Concern. Nairobi: UNEP; 2022. |
| [4] | Majumder AK. Noise Induced Hearing Quality Assessments of Traffic Police Personnel in Dhaka City. Journal of Environment Pollution and Human Health. 2018; 6(4): 121-5. |
| [5] | Majumder AK, Bhuiyan, ML, Akter, S. Status of Noise Pollution in Different Silent Zone of Lalmatia Residential Area of Dhaka City. Journal of SUB. 2016; 6(1): 81–91. |
| [6] | Majumder AK. Health Impact Assessment of Noise Pollution on Traffic Policemen of Kathmandu Valley, Nepal. Stamford Journal of Environment and Human Habitat. 2012; 1: 120–32. |
| [7] | Majumder AK, Rauniyar R, Carter WS, Khanal SN, Bajracharya RM, Joshi SK. Noise induced hearing loss of Kathmandu valley traffic police: A self reported occupational health study. Bangladesh J Environ Sci. 2010; 18: 77-82. |
| [8] | Alam MJB, Rauf, AFMA, Ahmed, MF. Traffic induced noise pollution in Dhaka City. J Civil Engineer 2001; 29(1): 1-9. |
| [9] | Wongsurakiat P, Maranetra KN, Nana A, Naruman C, Aksornint M, Chalermsanyakorn T. Respiratory symptoms and pulmonary function of traffic policemen in Thonburi. Journal of the Medical Association of Thailand; Chotmaihet thangphaet. 1999 May 1; 82(5): 435-43. |
| [10] | Karita K, Yano E, Jinsart W, Boudoung D, Tamura K. Respiratory symptoms and pulmonary function among traffic police in Bangkok, Thailand. Archives of Environmental Health: An International Journal. 2001 Sep 1; 56(5): 467-70. |
| [11] | Shrestha I. Health Effects of Vehicular Noise Pollution on Traffic Police Personnel in Kathmandu. Dissertation submitted in partial fulfillment of the requirements for the degree of Bachelor of Science, Department of Environment Science, St Xavier’s College. 1998. |
| [12] | Shakya S. Health problems prevalent in the Traffic police personnel due to vehicular air pollution in Kathmandu (Doctoral dissertation, Dissertation submitted in partial fulfillment of the requirement of the requirements of the degree of Bachelor of Science (Environmental Science), St. Xavier’s College, Kathmandu). 2001. |
| [13] | Tamura K, Jinsart W, Yano E, Karita K, Boudoung D. Particulate air pollution and chronic respiratory symptoms among traffic policemen in Bangkok. Archives of Environmental Health: An International Journal. 2003 Apr 1; 58(4): 201-7. |
| [14] | DeToni A, Finotto L. Respiratory diseases in a group of traffic police officers: results of a 5-year follow-up. Giornale italiano di medicina del lavoro ed ergonomia. 2005 Jul 1; 27(3): 380-2. |
| [15] | Tripathi SR, Tiwari RR. Self-reported hearing quality of traffic policemen: A questionnaire-based study. Indian journal of occupational and environmental Medicine. 2006 May 1; 10(2): 82-4. |
| [16] | World Health Organization. The world health report 2002: reducing risks, promoting healthy life. World Health Organization; 2002. |
| [17] | Nandi SS, Dhatrak SV. Occupational noise-induced hearing loss in India. Indian journal of occupational and environmental medicine. 2008 May 1; 12(2): 53-6. |
| [18] | NIOSH. Criteria for a recommended standard: occupational noise exposure. Cincinnati, OH, National Institute for Occupational Safety and Health. 1998. |
| [19] | World Health Organization. Occupational and community noise. In Occupational and community noise 2001. |
| [20] | Majumder AK, Islam, KMN, Biswas, JD, Paul, B. Assessment of Citizens Perception towards Traffic Noise Induced Hearing Loss in Dhaka City. Stamford Journal of Civil Engineering. 2011; 3(1). |
| [21] | Suter A. The noise manual. 5th ed. Berger E, Royster L, Rozster J, Driscoll D, Layne M, editors. American Industrial Hygiene Association, Fairfax, VA.; 2000. |
| [22] | Goelzer BI. Hazard prevention and control programmes. Goelzer, B., Hansen, CH, Sehrndt, GA (Ed.). Occupational Exposure to Noise: Evaluation. Prevention and Control, WHO, Geneva. 2001; 233: 244. |
| [23] | Murthy VK, Majumder AK, Khanal SN, Subedi DP. Assessment of traffic noise pollution in Banepa, a semi urban town of Nepal. Kathmandu University journal of science, engineering and technology. 2007; 3(2): 12-20. |
| [24] | Bluhm G, Nordling E, Berglind N. Road traffic noise and annoyance-An increasing environmental health problem. Noise and Health. 2004 Jul 1; 6(24): 43-9. |
| [25] | Meijer H, Knipschild P, Sallé H. Road traffic noise annoyance in Amsterdam. International archives of occupational and environmental health. 1985 Oct; 56: 285-97. |
| [26] | Ouis D. Annoyance caused by exposure to road traffic noise: An update. Noise and Health. 2002 Apr 1; 4(15): 69-79. |
| [27] | Öhrström E. Longitudinal surveys on effects of changes in road traffic noise—annoyance, activity disturbances, and psycho-social well-being. The Journal of the Acoustical Society of America. 2004 Feb 1; 115(2): 719-29. |
| [28] | De Hollander AE, van Kempen EE, Houthuijs DJ, Van Kamp I, Hoogenveen RT, Staatsen BA. Environmental noise: an approach for estimating health impacts at national and local level. Geneva: World Health Organization (Environmental Burden of Disease series). 2004. |
| [29] | Environmental Conservation Rules. Ministry of Environment & Forest, Government of the People’s Republic of Bangladesh. 2006. |
APA Style
Majumder, A. K., Bhuiyan, M. T. A. (2025). Assessing the Extent of Noise Pollution in Laxmipur District Town, Bangladesh. International Journal of Environmental Monitoring and Analysis, 13(2), 61-73. https://doi.org/10.11648/j.ijema.20251302.12
ACS Style
Majumder, A. K.; Bhuiyan, M. T. A. Assessing the Extent of Noise Pollution in Laxmipur District Town, Bangladesh. Int. J. Environ. Monit. Anal. 2025, 13(2), 61-73. doi: 10.11648/j.ijema.20251302.12
@article{10.11648/j.ijema.20251302.12,
  author = {Ahmad Kamruzzaman Majumder and Md. Taiful Arefin Bhuiyan},
  title = {Assessing the Extent of Noise Pollution in Laxmipur District Town, Bangladesh
},
  journal = {International Journal of Environmental Monitoring and Analysis},
  volume = {13},
  number = {2},
  pages = {61-73},
  doi = {10.11648/j.ijema.20251302.12},
  url = {https://doi.org/10.11648/j.ijema.20251302.12},
  eprint = {https://article.sciencepublishinggroup.com/pdf/10.11648.j.ijema.20251302.12},
  abstract = {Noise pollution is a concerning issue in Bangladesh due to its impact on human health. It is increasing in Laxmipur District Town in recent years due to the introduction of a number of different vehicles. Some vehicles, particularly rickshaws and auto-rickshaws, may use outdated mechanical horns, exacerbating the noise, the use of heavy machinery for construction, and the unregulated use of loudspeakers in social, religious, and political events and public announcements. The current study has been carried out to assess the extent of noise pollution in various areas of Laxmipur District Town. 7 different zones, along with 45 locations, were selected in Laxmipur District Town based on land use. A sound level meter (REED SD-4023) was used to monitor noise levels in Laxmipur District Town from January 01, 2021, to April 30, 2021. At each sampling location, several samples were collected. Three times a day, we have measured the noise level in every location. The mean noise pollution level and Leq of Laxmipur District Town were determined to be 68.78 dBA and 92.46 dBA, respectively. The measured mean and Leq values were 69.11 dBA and 89.00 dBA for silent areas, 67.76 dBA and 79.34 dBA for residential areas, 76.75 dBA and 82.32 dBA for mixed areas, 70.90 dBA and 81.07 dBA for commercial areas, 67.57 dBA and 95.70 dBA for industrial areas, 74.28 dBA and 87.29 dBA for road intersections, and 64.49 dBA and 75.40 dBA for village areas, respectively. The hierarchy in different land uses based on mean noise level was Mixed Areas > Road Intersection > Commercial Area > Silent Area > Residential Area > Industrial Area > Village Area. The three highest noise-polluted areas were Rehana Food (105.62 dBA), Titakha Mosjid-2 (98.49 dBA), and Dalal Bazar (96.75 dBA), whereas the three lowest noise-polluted areas were Vumi Office (58.51 dBA), Banchan Nogor (61.38 dBA), and Hi Food (66.19 dBA), based on Leq. However, a study found that every sample location's noise level exceeded the national guideline.
},
 year = {2025}
}
TY  - JOUR
T1  - Assessing the Extent of Noise Pollution in Laxmipur District Town, Bangladesh

AU  - Ahmad Kamruzzaman Majumder
AU  - Md. Taiful Arefin Bhuiyan
Y1  - 2025/06/20
PY  - 2025
N1  - https://doi.org/10.11648/j.ijema.20251302.12
DO  - 10.11648/j.ijema.20251302.12
T2  - International Journal of Environmental Monitoring and Analysis
JF  - International Journal of Environmental Monitoring and Analysis
JO  - International Journal of Environmental Monitoring and Analysis
SP  - 61
EP  - 73
PB  - Science Publishing Group
SN  - 2328-7667
UR  - https://doi.org/10.11648/j.ijema.20251302.12
AB  - Noise pollution is a concerning issue in Bangladesh due to its impact on human health. It is increasing in Laxmipur District Town in recent years due to the introduction of a number of different vehicles. Some vehicles, particularly rickshaws and auto-rickshaws, may use outdated mechanical horns, exacerbating the noise, the use of heavy machinery for construction, and the unregulated use of loudspeakers in social, religious, and political events and public announcements. The current study has been carried out to assess the extent of noise pollution in various areas of Laxmipur District Town. 7 different zones, along with 45 locations, were selected in Laxmipur District Town based on land use. A sound level meter (REED SD-4023) was used to monitor noise levels in Laxmipur District Town from January 01, 2021, to April 30, 2021. At each sampling location, several samples were collected. Three times a day, we have measured the noise level in every location. The mean noise pollution level and Leq of Laxmipur District Town were determined to be 68.78 dBA and 92.46 dBA, respectively. The measured mean and Leq values were 69.11 dBA and 89.00 dBA for silent areas, 67.76 dBA and 79.34 dBA for residential areas, 76.75 dBA and 82.32 dBA for mixed areas, 70.90 dBA and 81.07 dBA for commercial areas, 67.57 dBA and 95.70 dBA for industrial areas, 74.28 dBA and 87.29 dBA for road intersections, and 64.49 dBA and 75.40 dBA for village areas, respectively. The hierarchy in different land uses based on mean noise level was Mixed Areas > Road Intersection > Commercial Area > Silent Area > Residential Area > Industrial Area > Village Area. The three highest noise-polluted areas were Rehana Food (105.62 dBA), Titakha Mosjid-2 (98.49 dBA), and Dalal Bazar (96.75 dBA), whereas the three lowest noise-polluted areas were Vumi Office (58.51 dBA), Banchan Nogor (61.38 dBA), and Hi Food (66.19 dBA), based on Leq. However, a study found that every sample location's noise level exceeded the national guideline.

VL  - 13
IS  - 2
ER  -
Department of Environmental Science, Stamford University Bangladesh, Dhaka, Bangladesh; Center for Atmospheric Pollution Studies (CAPS), Dhaka, Bangladesh
Department of Environmental Science, Stamford University Bangladesh, Dhaka, Bangladesh
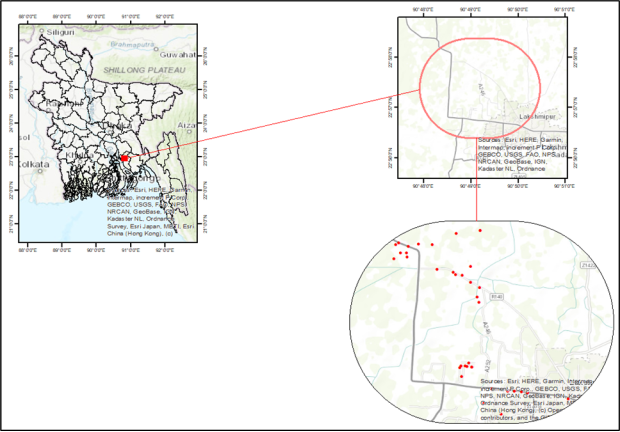
Figure 1. Study Area of Laxmipur District Town.
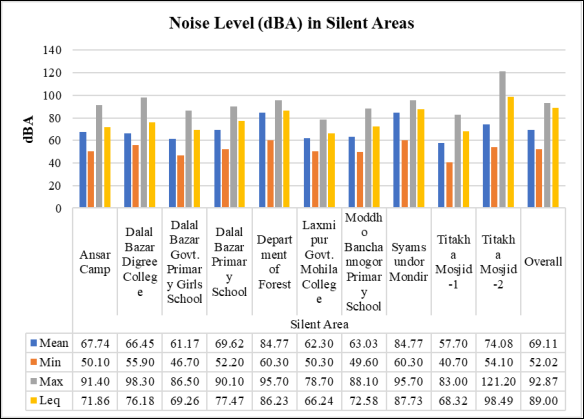
Figure 2. Noise Level (dBA) in Silent Areas.
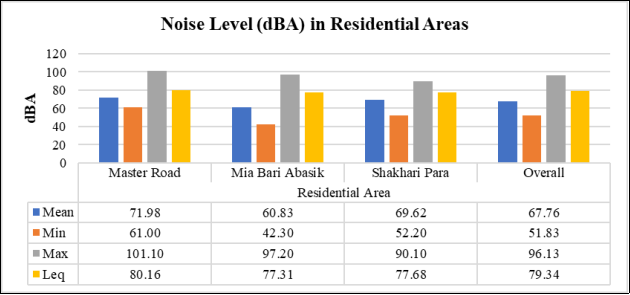
Figure 3. Noise Level (dBA) in Residential Areas.
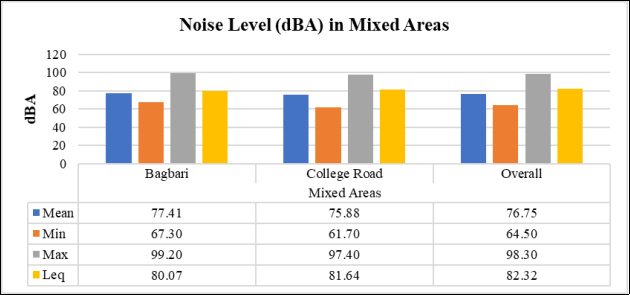
Figure 4. Noise Level (dBA) in Mixed Areas.
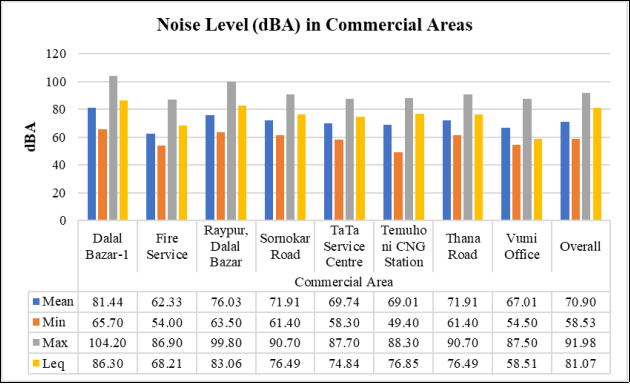
Figure 5. Noise Level (dBA) in Commercial Areas.
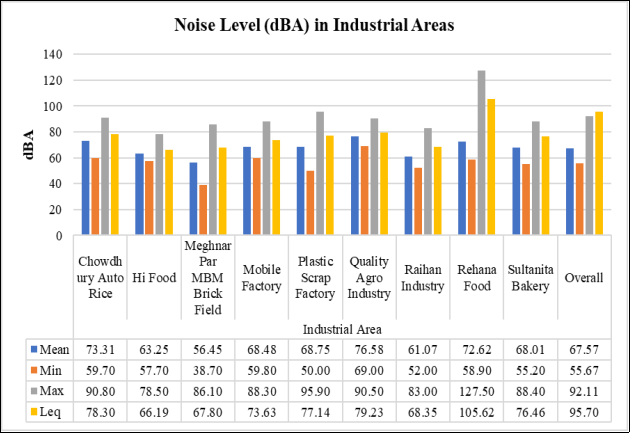
Figure 6. Noise Level (dBA) in Industrial Areas.
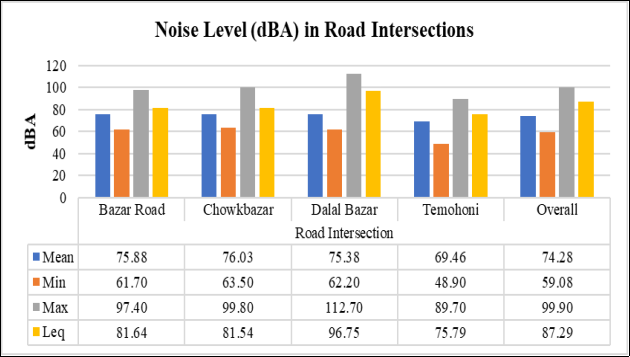
Figure 7. Noise Level (dBA) in Road Intersection.
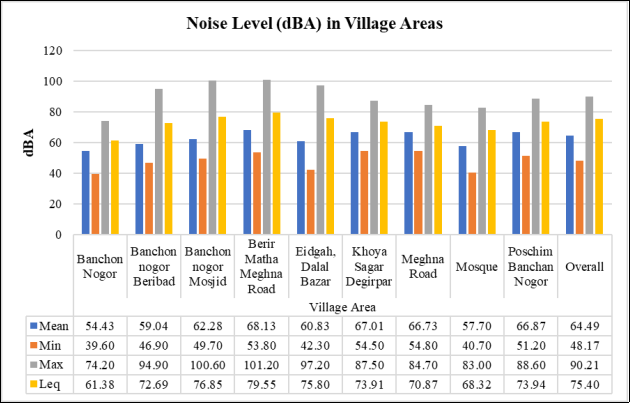
Figure 8. Noise Level (dBA) in Village Areas.
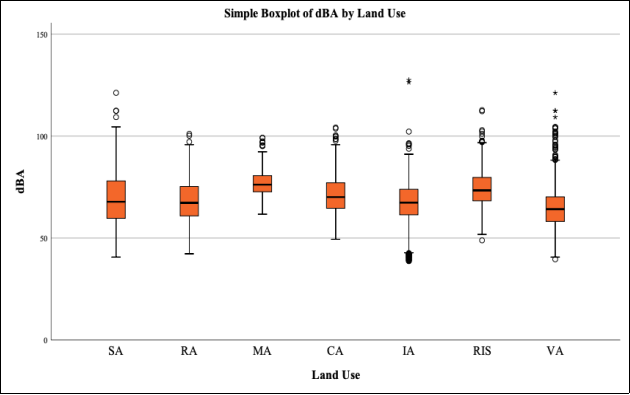
Figure 9. Mean Noise Pollution in Laxmipur District Town.
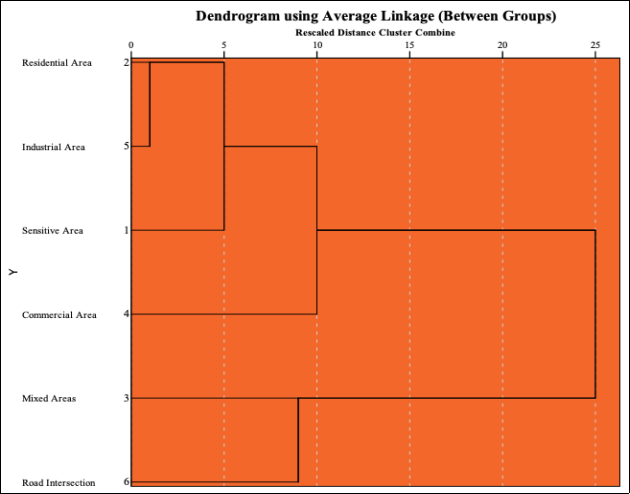
Figure 10. Land Use based Cluster, in Terms of dBA.
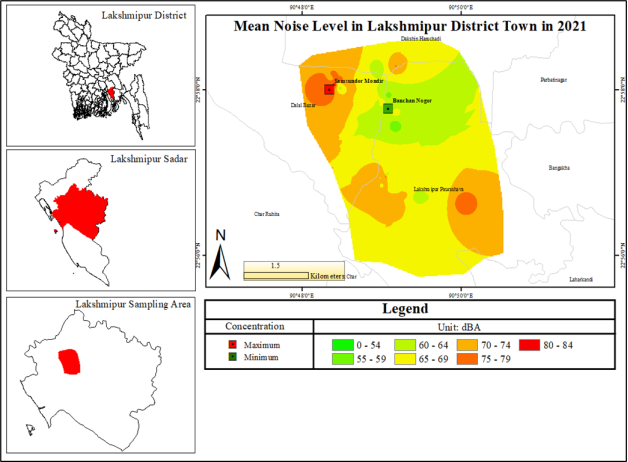
Figure 11. Spatial Map of Mean Noise Pollution.
Information

