This research article investigates Salmonella contamination in table eggs and broiler meat in Germany between 1992 and 2011. Data spanning two decades were analyzed to understand the factors influencing Salmonella contamination in poultry products and its impact on human cases of salmonellosis. The study reveals a historical perspective on Salmonella surveillance in Germany, emphasizing significant changes in surveillance strategies over the years. Since 1992, the data on Salmonella contamination in food were systematically collected, providing insights into the trends and patterns of contamination. The study highlights the pivotal role of table eggs as a major source of human salmonelloses, leading to the formulation of new regulations in 1994. The establishment of the zoonoses order in 1993 marked a significant step towards enhanced surveillance and reporting at the European level. The European Union's guidelines on zoonoses and the establishment of reference laboratories further strengthened the surveillance systems, facilitating data sharing and analysis across European countries. The introduction of national reporting officers and community reference laboratories for zoonotic agents improved data accuracy and consistency. The study showcases a correlation analysis method implemented since 2010, enhancing the understanding of the relationship between Salmonella contamination in poultry products and human infections. Results indicate a gradual reduction in Salmonella contamination levels in table eggs and poultry meat over the years, reflecting the effectiveness of regulatory measures and surveillance protocols. Overall, this research underscores the importance of continuous monitoring and surveillance in mitigating Salmonella-related risks in the food chain. The findings provide valuable insights for policymakers, health authorities, and stakeholders in enhancing food safety measures and reducing the burden of salmonellosis on public health.
| Published in | International Journal of Nutrition and Food Sciences (Volume 14, Issue 4) |
| DOI | 10.11648/j.ijnfs.20251404.19 |
| Page(s) | 267-279 |
| Creative Commons |
This is an Open Access article, distributed under the terms of the Creative Commons Attribution 4.0 International License (http://creativecommons.org/licenses/by/4.0/), which permits unrestricted use, distribution and reproduction in any medium or format, provided the original work is properly cited. |
| Copyright |
Copyright © The Author(s), 2025. Published by Science Publishing Group |
Salmonella, 1992-2011, Yearly Collection of Zoonoses Data, Yearly Books on Zoonoses, European Data Collection
1992 N | % pos. | 1993 N | % pos. | 1994 N | % pos. | 1995 N | % pos. | 1996 N | % pos. | |
|---|---|---|---|---|---|---|---|---|---|---|
SH | 804 | 1.24 | 1090 | 0.18 | 151 | 0 | 367 | 0.54 | 57 | 3.51 |
HB | 236 | 0.85 | 435 | 0 | 67 | 0 | 104 | 0.96 | ||
HH | 126 | 0 | 1051 | 0 | 1053 | 0.19 | 1048 | 0 | ||
NI | 3638 | 1.32 | 10404 | 0.35 | 4407 | 0.79 | 7056 | 2 | 1361 | 0.59 |
ST | 1556 | 4.31 | 4033 | 0.22 | 3733 | 0.59 | 7390 | 0.65 | 1129 | 4.52 |
MV | 991 | 0.30 | 2640 | 0.15 | 2104 | 0.62 | 3834 | 0.89 | 1648 | 1.83 |
NW | 8001 | 0.81 | 769 | 2.21 | 7532 | 0.41 | 9424 | 0.21 | 1000 | 1.6 |
BB | 1080 | 2.04 | 3298 | 0.30 | 2696 | 0.78 | 3470 | 0.72 | 411 | 1.95 |
BE | 800 | 0.63 | 3065 | 1.47 | 4451 | 0.47 | 2361 | 0 | 86 | 0 |
SL | 510 | 0 | 1261 | 0.32 | 208 | 1.44 | 84 | 0 | 44 | 0 |
RP | 877 | 0.46 | 1471 | 0.34 | 1402 | 0.14 | 768 | 0 | 150 | 0 |
HE | 4390 | 3.21 | 913 | 0.55 | 435 | 0.23 | 288 | 3.13 | ||
TH | 2018 | 0.10 | 4760 | 0.23 | 1466 | 1.84 | 436 | 2.52 | 2444 | 0.61 |
SN | 2922 | 0.55 | 5771 | 0.92 | 3050 | 0.23 | 4700 | 0.62 | 442 | 2.49 |
BW | 3164 | 0.19 | 8446 | 0.53 | 7809 | 0.35 | 6970 | 0.13 | 1253 | 0.24 |
BY | 22415 | 0.32 | 4427 | 0.36 | 3803 | 0.92 | 1321 | 0.61 | 322 | 8.07 |
DE | 0.86 | 0.49 | 0.57 | 0.68 | 1.49 |
1997 N | % pos. | 1998 N | % pos. | 1999 N | % pos. | 2000 N | % pos. | N | % pos. | |
|---|---|---|---|---|---|---|---|---|---|---|
SH | 2792 | 0.21 | 33 | 0 | 14 | 5.00 | 425 | 0.24 | 160 | 0 |
HB | 60 | 10.00 | 25 | 4.00 | 13 | 0 | 20 | 5.00 | ||
HH | 1708 | 0 | 717 | 0.28 | 356 | 0.77 | 128 | 0 | 480 | 0 |
NI | 5586 | 1.83 | 1902 | 0.63 | 368 | 1.09 | 469 | 0.85 | ||
ST | 14626 | 0.38 | 11850 | 0.23 | 6914 | 0.63 | 6950 | 0.22 | 4848 | 0.21 |
MV | 2274 | 1.23 | 955 | 0.21 | 912 | 0.42 | 994 | 0.70 | 1167 | 0.51 |
NW | 948 | 2.53 | 81 | 1424 | 0.12 | 327 | 1.22 | 313 | 1.28 | |
BB | 1050 | 1.14 | 1028 | 0.10 | 999 | 0.10 | 719 | 0.70 | 970 | 0.41 |
BE | 77 | 3.90 | 123 | 2.44 | 162 | 1.23 | 441 | 0 | 30 | 0 |
SL | 64 | 0 | 8 | 0 | 20 | 1.75 | 34 | 8.82 | 6 | 0 |
RP | 312 | 1.28 | 177 | 0 | 1622 | 0 | 412 | 0.24 | 252 | 0.40 |
HE | 82 | 0 | 173 | 0 | 10 | 0 | 46 | 0 | ||
TH | 1814 | 1.82 | 785 | 1.27 | 631 | 0 | 964 | 1.14 | 547 | 0.55 |
SN | 1620 | 6.17 | 869 | 1.15 | 687 | 0.16 | 394 | 1.27 | 324 | 5.86 |
BW | 562 | 7.47 | 224 | 0.89 | 579 | 0.35 | 206 | 5.83 | 861 | 1.51 |
BY | 572 | 2.80 | 550 | 2.55 | 273 | 0.37 | 986 | 0.30 | 988 | 0.40 |
DE | 1.03 | 0.41 | 0.36 | 0.53 | 0.6 |
2002 | 2003 | 2004 | 2005 | 2006 | ||||||
|---|---|---|---|---|---|---|---|---|---|---|
SH | 213 | 0.47 | 39 | 0 | 52 | 1.92 | 18 | 0 | 16 | 6.25 |
HB | 27 | 3.70 | 18 | 0 | 2 | 0 | 30 | 0 | ||
HH | 91 | 1.10 | 47 | 0 | 18 | 0 | 9 | 0 | 2 | 0 |
NI | 294 | 2.38 | 1335 | 0 | 355 | 0 | 137 | 0.73 | 39 | 2.56 |
ST | 6456 | 0.29 | 5401 | 0.19 | 5809 | 0.12 | 2886 | 0.10 | 341 | 1.17 |
MV | 1330 | 1.35 | 1220 | 0.49 | 630 | 0.32 | 1573 | 0.13 | 646 | 0 |
NW | 577 | 0.52 | 446 | 2.91 | 233 | 0.86 | 476 | 0.42 | 1437 | 0.49 |
BB | 358 | 0.84 | 430 | 1.40 | 334 | 0 | 273 | 1.10 | 242 | 2.07 |
BE | 109 | 0.92 | 175 | 0.57 | 152 | 0 | 673 | 0.15 | 105 | 1.90 |
SL | 54 | 0 | 67 | 0 | 5 | 0 | 12 | 0 | 553 | 0.18 |
RP | 200 | 1.00 | 135 | 1.48 | 197 | 1.02 | 278 | 0 | 174 | 0.57 |
HE | 647 | 0.77 | 59 | 0 | 123 | 0 | 756 | 1.32 | 169 | 0 |
TH | 672 | 0.60 | 235 | 0.85 | 369 | 1.63 | 739 | 1.62 | 272 | 1.10 |
SN | 368 | 2.72 | 357 | 3.36 | 296 | 1.35 | 265 | 1.51 | 237 | 0.84 |
BW | 658 | 1.82 | 610 | 0.66 | 719 | 2.92 | 89 | 3.37 | 411 | 0.24 |
BY | 2381 | 0.13 | 424 | 1.65 | 887 | 0 | 99 | 1.01 | 87 | 0 |
DE | 0.62 | 0.57 | 0.44 | 0.51 | 0.59 |
2007 | 2008 | 2009 | 2010 | 2011 | ||||||
|---|---|---|---|---|---|---|---|---|---|---|
SH | 13 | 0 | 62 | 0 | 49 | 0 | 1080 | 0 | 402 | 0 |
HB | 20 | 0 | 56 | 1.79 | ||||||
HH | 100 | 0 | 38 | 0 | 176 | 0 | 46 | 0 | 9 | 0 |
NI | 24 | 0 | 40 | 0 | 22 | 0 | 181 | 1.66 | 62 | 0 |
ST | 402 | 1.00 | 3 | 0 | 225 | 1.33 | 342 | 0 | 250 | 0 |
MV | 945 | 0.42 | 15 | 0 | 621 | 0.48 | 1178 | 0.17 | 623 | 0 |
NW | 1585 | 0.88 | 1338 | 0.15 | 2233 | 0.22 | 729 | 0.14 | 1692 | 0.06 |
BB | 233 | 0.43 | 3 | 0 | 208 | 1.92 | 547 | 0.18 | 172 | 0 |
BE | 906 | 0 | 397 | 0 | 1 | 0 | 4 | 0 | 5 | 0 |
SL | 41 | 0 | 1 | 0 | 49 | 0 | 23 | 0 | 64 | 0 |
RP | 188 | 0.53 | 264 | 1.52 | 266 | 0 | 242 | 0 | 260 | 0.38 |
HE | 1063 | 1.13 | 566 | 0 | 121 | 0 | 133 | 0.75 | 344 | 0 |
TH | 296 | 1.01 | 5 | 0 | 87 | 0 | 112 | 0 | 127 | 0 |
SN | 300 | 2.00 | 5 | 0 | 492 | 0.20 | 353 | 0 | 335 | 0 |
BW | 272 | 0.37 | 1015 | 0 | 248 | 0.40 | 2264 | 0.04 | 11703 | 0.01 |
BY | 14 | 0 | 666 | 0.15 | 2378 | 0.29 | 44 | 2.27 | ||
DE | 0.72 | 0.25 | 0.33 | 0.17 | 0.03 |
19921 N | % pos. | 19931 N | % pos. | 19941 N | % pos. | 19951 N | % pos. | 19961 N | % pos. | 1997 N | % pos. | |
|---|---|---|---|---|---|---|---|---|---|---|---|---|
SH | 247 | 2.43 | 74 | 20.27 | 247 | 23.08 | 50 | 22 | 39 | 23.08 | ||
HB | 47 | 25.53 | 77 | 22.08 | 454 | 9.91 | 26 | 15.38 | 8 | 0 | ||
HH | 150 | 0 | 95 | 5.26 | 118 | 3.39 | 108 | 2.78 | 85 | 10.59 | 28 | 14.29 |
NI | 335 | 11.34 | 293 | 12.97 | 376 | 21.01 | 108 | 18.52 | 1554 | 28.89 | 19 | 21.05 |
ST | 738 | 4.34 | 354 | 19.21 | 289 | 9.69 | 40 | 62.5 | 72 | 12.50 | 58 | 27.59 |
MV | 502 | 6.77 | 1346 | 8.17 | 1076 | 7.43 | 250 | 38 | 185 | 30.27 | 130 | 23.08 |
NW | 133 | 19.55 | 198 | 24.24 | 169 | 18.93 | 129 | 19.38 | 132 | 12.88 | 106 | 13.21 |
BB | 487 | 13.96 | 1351 | 6.00 | 296 | 22.64 | 97 | 37.11 | 261 | 11.49 | ||
BE | 323 | 15.48 | 285 | 31.58 | 110 | 16.36 | 86 | 41.86 | 61 | 29.51 | ||
SL | 57 | 15.79 | 63 | 38.10 | 115 | 39.13 | 23 | 17.39 | 8 | 37.50 | 16 | 25.00 |
RP | 157 | 5.10 | 108 | 18.52 | 98 | 4.08 | 99 | 12.12 | 62 | 30.65 | 38 | 15.79 |
HE | 245 | 30.61 | 338 | 13.02 | 316 | 18.04 | ||||||
TH | 565 | 15.75 | 606 | 17.66 | 606 | 15.68 | 761 | 22.6 | 288 | 48.26 | 702 | 32.62 |
SN | 824 | 11.53 | 576 | 17.19 | 526 | 13.50 | 509 | 19.84 | 237 | 26.16 | 124 | 64.52 |
BW | 506 | 12.45 | 655 | 15.73 | 802 | 20.95 | 592 | 11.99 | 625 | 22.56 | 110 | 23.64 |
BY | 941 | 48.78 | 641 | 43.37 | 988 | 25.10 | 408 | 28.92 | 344 | 33.72 | 384 | 35.94 |
DE | 17.00 | 16.25 | 16.67 | 22.36 | 27.17 | 30.44 |
19982 N | % pos. | 19992 N | % pos. | 20002 N | % pos. | 20012 N | % pos. | |
|---|---|---|---|---|---|---|---|---|
SH | 20 | 15.00 | 1 | 0 | 64 | 7.81 | 3 | 0 |
HB | 14 | 0 | 11 | 0 | ||||
HH | 55 | 9.09 | 45 | 4.44 | 88 | 4.55 | 19 | 5.26 |
NI | 127 | 14.96 | 102 | 1.96 | 137 | 25.55 | ||
ST | 47 | 4.26 | 35 | 5.71 | 38 | 2.63 | 49 | 2.04 |
MV | 79 | 24.05 | 74 | 12.16 | 70 | 14.29 | 118 | 23.73 |
NW | 6 | 16.67 | 41 | 12.20 | 173 | 20.81 | 72 | 11.11 |
BB | 51 | 21.57 | 45 | 13.33 | 12 | 16.67 | 82 | 10.98 |
BE | 142 | 20.42 | 60 | 11.67 | 117 | 12.82 | 144 | 15.97 |
SL | 14 | 0 | 22 | 4.55 | 14 | 7.14 | 1 | 0 |
RP | 9 | 0 | 152 | 21.71 | 52 | 11.54 | 39 | 5.13 |
HE | 58 | 8.62 | 38 | 7.89 | 44 | 4.55 | ||
TH | 240 | 32.92 | 187 | 24.06 | 206 | 25.24 | 203 | 11.33 |
SN | 83 | 30.12 | 69 | 21.74 | 71 | 26.76 | ||
BW | 168 | 15.48 | 184 | 20.11 | 115 | 27.83 | 45 | 11.11 |
BY | 127 | 29.13 | 92 | 11.96 | 255 | 35.29 | 122 | 13.93 |
DE | 21.70 | 17.28 | 19.07 | 15.68 |
20022 | 20032 | 2004 | 2005 | 2006 | ||||||
|---|---|---|---|---|---|---|---|---|---|---|
SH | 94 | 9.57 | 19 | 10.53 | 100 | 9 | 12 | 41.67 | 5 | 20.00 |
HB | 5 | 0 | 15 | 13.33 | 15 | 0 | ||||
HH | 22 | 0 | 17 | 0 | 13 | 23.08 | 28 | 7.14 | ||
NI | 134 | 19.40 | 122 | 13.93 | 94 | 13.83 | 273 | 10.62 | 122 | 12.30 |
ST | 82 | 10.98 | 44 | 13.64 | 52 | 3.85 | 138 | 8.70 | 104 | 2.88 |
MV | 69 | 13.04 | 55 | 20.00 | 40 | 7.50 | 57 | 7.02 | 41 | 12.20 |
NW | 156 | 13.46 | 73 | 6.85 | 25 | 16.00 | 104 | 4.81 | 110 | 11.82 |
BB |
| 2 | 50.00 | 2 | 0 | |||||
BE | 61 | 1.64 | 89 | 16.85 | 98 | 9.18 | 63 | 6.35 | 118 | 8.47 |
SL | 20 | 0 | 11 | 27.27 | 48 | 20.83 | 37 | 24.32 | 24 | 12.50 |
RP | 83 | 10.84 | 32 | 12.50 | 105 | 5.71 | 21 | 9.52 | 5 | 20.00 |
HE | 44 | 13.64 | 84 | 21.43 | 168 | 15.48 | 101 | 7.92 | 75 | 13.33 |
TH | 220 | 14.55 | 199 | 13.07 | 48 | 4.17 | 118 | 5.93 | 131 | 8.40 |
SN | 131 | 15.27 | 85 | 14.12 | 2 | 50.00 | 77 | 12.99 | ||
BW | 76 | 18.42 | 152 | 21.71 | 197 | 11.17 | 62 | 3.23 | 182 | 8.79 |
BY | 220 | 27.27 | 236 | 33.47 | 118 | 12.71 | 375 | 14.13 | 408 | 9.31 |
DE | 15.01 | 16.46 | 11.04 | 10.28 | 9.70 |
2007 | 2008 | 2009 | 2010 | 2011 | ||||||
|---|---|---|---|---|---|---|---|---|---|---|
SH | 4 | 25.00 | 6 | 0 | 7 | 0 | 9 | 0 | 12 | 0 |
HB | 56 | 7.14 | 10 | 0 | 4 | 0 | ||||
HH | 42 | 0 | 92 | 1.09 | 7 | 14.29 | 34 | 5.88 | 32 | 6.25 |
NI | 19 | 10.53 | 182 | 19.23 | 117 | 5.98 | 233 | 13.30 | 2 | 0 |
ST | 32 | 6.25 | 1 | 0 | 37 | 5.41 | 71 | 7.04 | 9 | 22.22 |
MV | 54 | 11.11 | 44 | 6.82 | 37 | 8.11 | 63 | 4.76 | ||
NW | 108 | 10.19 | 93 | 6.45 | 201 | 6.47 | 220 | 4.55 | 462 | 1.95 |
BB | 11 | 27.27 | 1 | 0 | 2 | 0 | 3 | 0 | 9 | 22.22 |
BE | 81 | 6.17 | 102 | 2.94 | 90 | 3.33 | 80 | 5.00 | 79 | 7.59 |
SL | 10 | 0 | 5 | 0 | 5 | 0 | 18 | 5.56 | ||
RP | 76 | 10.53 | 79 | 5.06 | 22 | 13.64 | 18 | 5.56 | 1 | 0 |
HE | 12 | 8.33 | 25 | 60.00 | 1 | 0 | 3 | 0 | ||
TH | 136 | 6.62 | 1 | 0 | 8 | 0 | 11 | 9.09 | 18 | 5.56 |
SN | 6 | 33.33 | 2 | 0 | 8 | 12.50 | ||||
BW | 119 | 12.61 | 58 | 12.07 | 101 | 7.92 | 9 | 0 | 14 | 0 |
BY | 2 | 0 | 10 | 0 | 105 | 13.33 | 86 | 10.47 | ||
DE | 8.79 | 10.32 | 6.23 | 8.45 | 4.41 |
Institution | Surveillance system | Year | Zoonoses regulation |
|---|---|---|---|
Federal Health Institute (BGA) | Salmonella surveillance with questionnaires (MS Word. Manual database input) | 1990 | Federal epidemic law for human diseases |
1991 | Start Salmonella surveillance | ||
1992 | Zoonoses guideline (92/117/EWG) | ||
1994 | Table egg order. hens-Salmonella order | ||
Federal Institute for consumer protection and veterinary medicine (BgVV) | 1995 | New institute | |
1996 | National reference laboratory for the Epidemiology of Zoonoses (NRLE) | ||
Zoonosenes reporting with Questionnaires (Excel) | 1997 | Food as plan samples reported | |
2001 | New infection protection law (IFSG) | ||
2004 | Zoonoses guideline (2003/99/EG). Zoonoses-Protection order (VO EG No. 2160/2003) | ||
Questionnaires via e-mails und are automatically red into a database | 2005 | Reporting Officer for the EFSA-Data transfer to EEC | |
2006 | Breeding hens VO EG Nr. 1003/2005 | ||
2007 | Laying hens VO EG Nr. 1168/2006 | ||
Federal Institute for Risk Assessment (BfR) | 2008 | Broiler VO EG No. 646/2007 | |
Table eggs VO EG No. 1237/2007 | |||
2009 | Breeding turkey. VO EG No. 584/2008 | ||
2011 | Correlation over several years |
| [1] |
Cf
http://www.bfr.bund.de/de/zoonosenberichterstattung_durch_das_bfr-300.html can BgVV- and BfR-books on the Epidemiology of Zoonoses from 1996 be found. |
| [2] | AVV RÜb (2008): AVV Rahmen Überwachung – Allgemeine Verwaltungsvorschrift über Grundsätze zur Durchführung der amtlichen Überwachung der Einhaltung lebensmittelrechtlicher, wein-rechtlicher, futtermittelrechtlicher und tabakrechtlicher Vorschriften. GMBl vom 11. Juni 2008 p. 425. |
| [3] | DGE (1996): Ernährungsbericht 1996 – Kapitel 5. Deutsche Gesellschaft für Ernährung e.V., Frankfurt a. M., p. 187-201. |
| [4] | EFSA (2013): The European Union Summary Report on Trends and Sources of Zoonoses. |
| [5] | Zoonotic Agents and Food-borne Outbreaks in 2011. |
| [6] | Hartung, M. (1992): S. enteritidis und S. typhimurium in veterinärmedizinischen Salmonella-Isolaten (1984-1991). Bundesgesundheitsblatt 35 (8), p. 383-388. |
| [7] | Hartung, M. (1993): Salmonellose-Überwachung in Lebensmitteln, bei Nutztieren und in der Umwelt, 1991. Bundesgesundheitsblatt 36 (7): p. 267-274. |
| [8] | Hartung, M. (1994): Ergebnisse der Jahreserhebung 1993 über Salmonellenbefunde in lebensmittelhygienischen und veterinärmedizinischen Institutionen. Ergebnisprotokoll der 47. Arbeitstagung des Arbeitskreises Lebensmittelhygienischer Tierärztlicher Sachverständiger vom 21.06.-23.06.1994 in Berlin. |
| [9] | Hartung, M. (1995): Ergebnisse der Jahreserhebung 1994 über Salmonellenbefunde. Vortrag auf der 48. Arbeitstagung des Arbeitskreises Lebensmittelhygienischer Tierärztlicher Sachverständiger vom 20.06.-22.06.1995 in Berlin. |
| [10] | Hartung, M. (1996): Ergebnisse der Jahreserhebung 1995 über Salmonellenbefunde. Vortrag auf der 49. Arbeitstagung des Arbeitskreises Lebensmittelhygienischer Tierärztlicher Sachverständiger vom 18.06.-19.06.1995 in Berlin. |
| [11] | Hartung, M. (1997): Bericht über die epidemiologische Situation der Zoonosen in Deutschland für 1995. BgVV-Hefte 12/1997, 100 p., 1 Abb., 38 Tab. |
| [12] | Hartung, M. (1998) (Ed.): Bericht über die epidemiologische Situation der Zoonosen in Deutschland für 1996. BgVV-Hefte 09/1998, 109 p., 2 Abb., 51 Tab. |
| [13] | Hartung, M. (1999) (Ed.): Bericht über die epidemiologische Situation der Zoonosen in Deutschland für 1997. BgVV-Hefte 06/1999, 138 p., 1 Abb., 46 Tab. |
| [14] | Hartung, M. (1999) (Ed.): Bericht über die epidemiologische Situation der Zoonosen in Deutschland für 1998. BgVV-Hefte 09/1999, 172 p., 4 Abb., 52 Tab. |
| [15] | Hartung, M. (2000) (Ed.): Bericht über die epidemiologische Situation der Zoonosen in Deutschland für 1999. BgVV-Hefte 08/2000, 220 p., 16 Abb., 53 Tab. |
| [16] | Hartung, M. (2001) (Ed.): Bericht über die epidemiologische Situation der Zoonosen in Deutschland für 2000. BgVV-Hefte 06/2001, 261 p., 43 Abb., 67 Tab. |
| [17] | Hartung, M. (2002) (Ed.): Bericht über die epidemiologische Situation der Zoonosen in Deutschland für 2001. BgVV-Hefte 06/2002, 275 p., 25 Abb., 70 Tab. |
| [18] | Hartung, M. (2004) (Ed.): Bericht über die epidemiologische Situation der Zoonosen in Deutschland für 2002. BfR-Wissenschaft 02/2004, 251 p., 26 Abb., 76 Tab. |
| [19] | Hartung, M. (2004) (Ed.): Epidemiologische Situation der Zoonosen in Deutschland im Jahr 2003. BfR-Wissenschaft 05/2004, 273 p., 25 Abb., 76 Tab. |
| [20] | Hartung, M. (2006) (Ed.): Epidemiologische Situation der Zoonosen in Deutschland im Jahr 2004. BfR-Wissenschaft 04/2006, 280 p., 46 Abb., 70 Tab. |
| [21] | Hartung, M. (2007) (Ed.): Epidemiologische Situation der Zoonosen in Deutschland im Jahr 2005. BfR-Wissenschaft 03/2007, 306 p., 56 Abb., 72 Tab. |
| [22] | Hartung, M. (2008) (Ed.): Erreger von Zoonosen in Deutschland im Jahr 2006. BfR-Wissenschaft 04/2008, 207 p., 34 Abb., 63 Tab. |
| [23] | Hartung, M. (2009): Erreger von Zoonosen in Deutschland im Jahr 2007. BfR-Wissenschaft 5/2009, 211 p., 35 Abb., 63 Tab. |
| [24] | Hartung, M. (2010): Erreger von Zoonosen in Deutschland im Jahr 2008. BfR-Wissenschaft 6/2010, 234 p., 34 Abb., 80 Tab. |
| [25] | Hartung, M. und Käsbohrer A (2011): Erreger von Zoonosen in Deutschland im Jahr 2009. BfR-Wissenschaft 1/2011, 237 p., 39 Abb., 99 Tab. |
| [26] | Hartung, M. und Käsbohrer A (2012): Erreger von Zoonosen in Deutschland im Jahr 2010. BfR-Wissenschaft 6/2012, 256 p., 43 Abb., 96 Tab. |
| [27] | Hartung, M. und Käsbohrer A (2013): Erreger von Zoonosen in Deutschland im Jahr 2011. BfR-Wissenschaft 5/2016, 285 p., 43 Abb., 107 Tab. |
| [28] | Hartung, M., K. Alt, A. Käsbohrer, B.-A. Tenhagen (2018): Erreger von Zoonosen in Deutschland im Jahr 2017. BfR-Wissenschaft 05/2020), 257 pages, 29 figures, 87 Tables. |
| [29] | RKI (2012): Infektionsepidemiologisches Jahrbuch meldepflichtiger Krankheiten für 2011. RKI, Berlin, 200 p. |
| [30] | SCHMIDT, K (1995): WHO surveillance programme for control of foodborne infections and intoxications in Europe – Sixth report 1990-1992. Federal Institute for Health Protection of consumers and Veterinary Medicine (FAO/WHO Collaborating Centre for Research and training in food hygiene and zoonoses), 340 p. |
| [31] | SCHROETER A, Hartung M, Pietzsch O, Rabsch W, Helmuth R (1992): Zum S. enteritidis-Geschehen in der Bundesrepublik Deutschland - Vergleichende Untersuchungen der Jahre 1990/1991. Bundesgesundheitsblatt 35 (8), p. 377-383. |
| [32] | VERORDNUNG (EU) Nr. 1168/2006 DER KOMMISSION vom 31. Juli 2006 zur Durchführung der Verordnung (EG) Nr. 2160/2003 des Europäischen Parlaments und des Rates hinsichtlich eines Gemeinschaftsziels zur Eindämmung der Prävalenz bestimmter Salmonellen-Serotypen bei Legehennen der Spezies Gallus gallus und zur Änderung der Verordnung (EG) Nr. 1003/2005. |
APA Style
Hartung, M. (2025). Salmonella Contamination in Table Eggs and Meat from Broiler in Germany from 1992 to 2011. International Journal of Nutrition and Food Sciences, 14(4), 267-279. https://doi.org/10.11648/j.ijnfs.20251404.19
ACS Style
Hartung, M. Salmonella Contamination in Table Eggs and Meat from Broiler in Germany from 1992 to 2011. Int. J. Nutr. Food Sci. 2025, 14(4), 267-279. doi: 10.11648/j.ijnfs.20251404.19
@article{10.11648/j.ijnfs.20251404.19,
  author = {Matthias Hartung},
  title = {Salmonella Contamination in Table Eggs and Meat from Broiler in Germany from 1992 to 2011
},
  journal = {International Journal of Nutrition and Food Sciences},
  volume = {14},
  number = {4},
  pages = {267-279},
  doi = {10.11648/j.ijnfs.20251404.19},
  url = {https://doi.org/10.11648/j.ijnfs.20251404.19},
  eprint = {https://article.sciencepublishinggroup.com/pdf/10.11648.j.ijnfs.20251404.19},
  abstract = {This research article investigates Salmonella contamination in table eggs and broiler meat in Germany between 1992 and 2011. Data spanning two decades were analyzed to understand the factors influencing Salmonella contamination in poultry products and its impact on human cases of salmonellosis. The study reveals a historical perspective on Salmonella surveillance in Germany, emphasizing significant changes in surveillance strategies over the years. Since 1992, the data on Salmonella contamination in food were systematically collected, providing insights into the trends and patterns of contamination. The study highlights the pivotal role of table eggs as a major source of human salmonelloses, leading to the formulation of new regulations in 1994. The establishment of the zoonoses order in 1993 marked a significant step towards enhanced surveillance and reporting at the European level. The European Union's guidelines on zoonoses and the establishment of reference laboratories further strengthened the surveillance systems, facilitating data sharing and analysis across European countries. The introduction of national reporting officers and community reference laboratories for zoonotic agents improved data accuracy and consistency. The study showcases a correlation analysis method implemented since 2010, enhancing the understanding of the relationship between Salmonella contamination in poultry products and human infections. Results indicate a gradual reduction in Salmonella contamination levels in table eggs and poultry meat over the years, reflecting the effectiveness of regulatory measures and surveillance protocols. Overall, this research underscores the importance of continuous monitoring and surveillance in mitigating Salmonella-related risks in the food chain. The findings provide valuable insights for policymakers, health authorities, and stakeholders in enhancing food safety measures and reducing the burden of salmonellosis on public health.},
 year = {2025}
}
TY  - JOUR
T1  - Salmonella Contamination in Table Eggs and Meat from Broiler in Germany from 1992 to 2011

AU  - Matthias Hartung
Y1  - 2025/08/21
PY  - 2025
N1  - https://doi.org/10.11648/j.ijnfs.20251404.19
DO  - 10.11648/j.ijnfs.20251404.19
T2  - International Journal of Nutrition and Food Sciences
JF  - International Journal of Nutrition and Food Sciences
JO  - International Journal of Nutrition and Food Sciences
SP  - 267
EP  - 279
PB  - Science Publishing Group
SN  - 2327-2716
UR  - https://doi.org/10.11648/j.ijnfs.20251404.19
AB  - This research article investigates Salmonella contamination in table eggs and broiler meat in Germany between 1992 and 2011. Data spanning two decades were analyzed to understand the factors influencing Salmonella contamination in poultry products and its impact on human cases of salmonellosis. The study reveals a historical perspective on Salmonella surveillance in Germany, emphasizing significant changes in surveillance strategies over the years. Since 1992, the data on Salmonella contamination in food were systematically collected, providing insights into the trends and patterns of contamination. The study highlights the pivotal role of table eggs as a major source of human salmonelloses, leading to the formulation of new regulations in 1994. The establishment of the zoonoses order in 1993 marked a significant step towards enhanced surveillance and reporting at the European level. The European Union's guidelines on zoonoses and the establishment of reference laboratories further strengthened the surveillance systems, facilitating data sharing and analysis across European countries. The introduction of national reporting officers and community reference laboratories for zoonotic agents improved data accuracy and consistency. The study showcases a correlation analysis method implemented since 2010, enhancing the understanding of the relationship between Salmonella contamination in poultry products and human infections. Results indicate a gradual reduction in Salmonella contamination levels in table eggs and poultry meat over the years, reflecting the effectiveness of regulatory measures and surveillance protocols. Overall, this research underscores the importance of continuous monitoring and surveillance in mitigating Salmonella-related risks in the food chain. The findings provide valuable insights for policymakers, health authorities, and stakeholders in enhancing food safety measures and reducing the burden of salmonellosis on public health.
VL  - 14
IS  - 4
ER  -
Federal Institute for Risk Assessment, Berlin, Germany
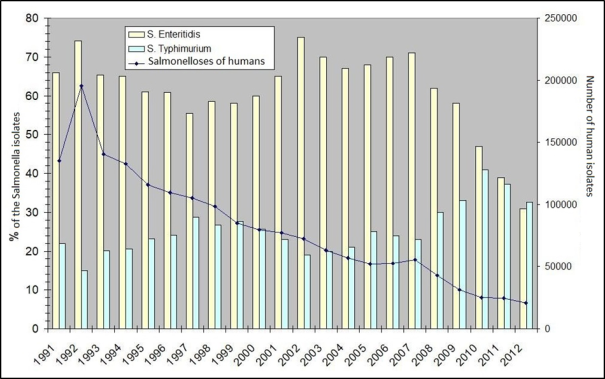
Figure 1. Salmonelloses in humans 1991-2012.
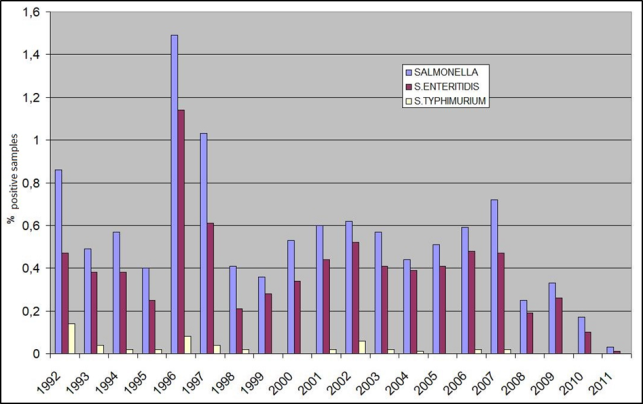
Figure 2. Table eggs 1992-2011 (from 1997 Plan samples).
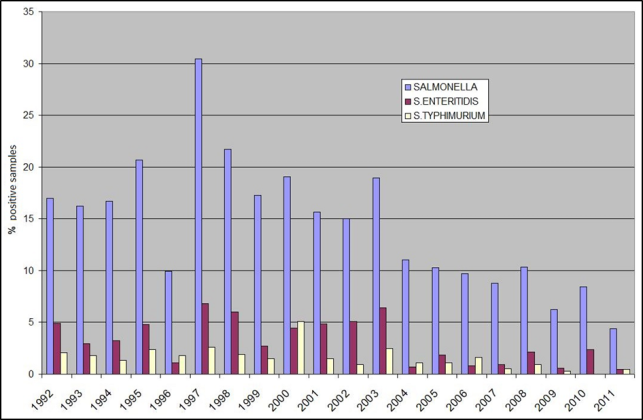
Figure 3. Broiler- and Hens meat 1992-2011 (from 1997 Plan samples).
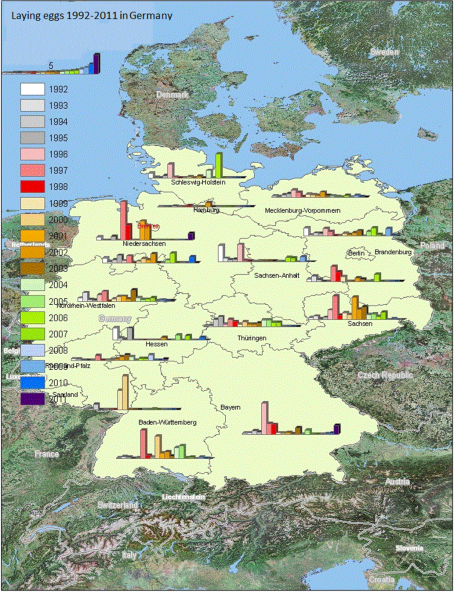
Figure 4. Table eggs 1992-2011- Thüringen (Thuringia). Sachsen (Saxony). Rheinland Pfalz (Rhineland Palatinate). Sachsen Anhalt (Saxony-Anhalt). Hessen (Hesse). Mecklenburg Vorpommern (Mecklenburg Western Pomerania). Nordrhein -Westfalen (Northrhine-Westphalia). Niedersachsen (Lower Saxony). Bayern (Bavaria).
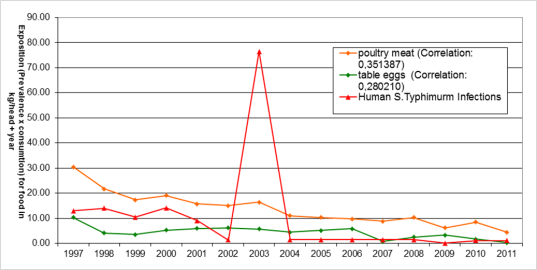
Figure 5. Correlation of table eggs and poultry meat with human incidences.
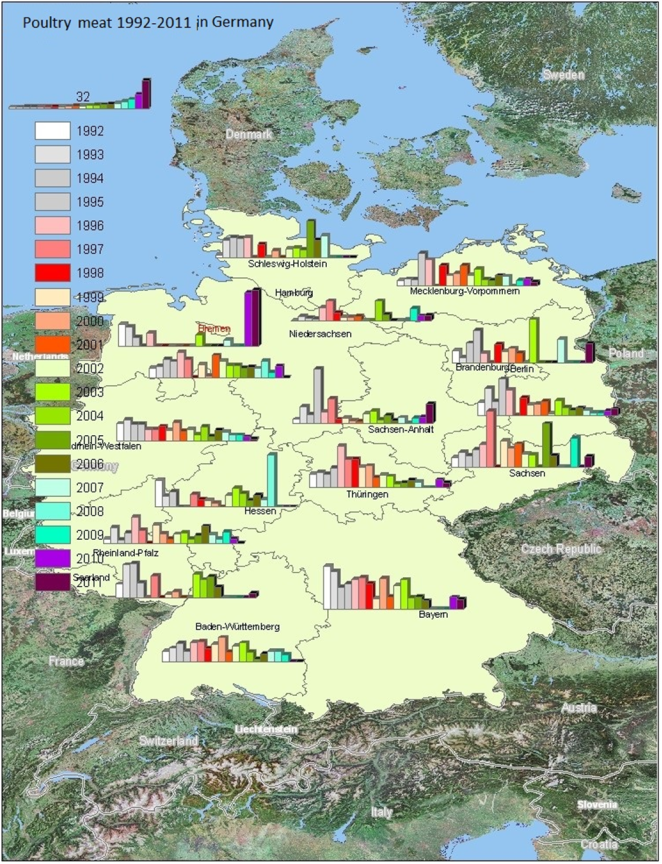
Figure 6. Meat from poultry meat 1992-2011 - Thüringen (Thuringia). Sachsen (Saxony). Rheinland Pfalz (Rhineland Palatinate). Sachsen Anhalt (Saxony-Anhalt). Hessen (Hesse). Mecklenburg Vorpommern (Mecklenburg Western Pomerania). Nordrhein-Westfalen (Northrhine-Westphalia). Niedersachsen (Lower Saxony). Bayern (Bavaria).
Information

