In this paper, we propose a novel fringe phase analysis method that can quickly and accurately perform the interference fringe analysis for precise measurement by using a conoscopic interferometer. In general, interference fringe phase analysis is an important issue for the measurement using laser interference. Although many studies have been carried out on the conoscopic interferometer and its applications, no full-scale study has been carried out on the problem of the phase analysis of the interference fringes and shortening the time in the precision measurement using the conoscopic interferometer. This problem can be solved by an efficient fringe analysis method. In the conoscopic interferometer, the precision measurement was performed by measuring the change in the number of fringes due to the change in distance. This method has low accuracy and slow measurement speed. In this paper, we propose a novel method to quickly analyze the phase of the conoscopic interference fringe by means of the determination of the extremum points and briefly discuss the interference fringe filtering. Since the interference pattern obtained in the conoscopic interferometer is related to the distance, the analysis of the interference pattern gives the distance. The interference pattern can be simply analyzed since the phase difference between two adjacent extrema is 2π. The proposed method allows a simple and rapid analysis of the interferogram of the conoscopic interferometer, thus increasing the accuracy and speed of precision measurements using the conoscopic interferometer. The proposed fringe analysis method can be used not only for the analysis of the conoscopic interference fringe but also for other sorts of fringe analysis.
| Published in | Optics (Volume 13, Issue 1) |
| DOI | 10.11648/j.optics.20251301.12 |
| Page(s) | 9-14 |
| Creative Commons |
This is an Open Access article, distributed under the terms of the Creative Commons Attribution 4.0 International License (http://creativecommons.org/licenses/by/4.0/), which permits unrestricted use, distribution and reproduction in any medium or format, provided the original work is properly cited. |
| Copyright |
Copyright © The Author(s), 2025. Published by Science Publishing Group |
Conoscopic Interferometer, Interference Fringe, Precision Measurement, Crystal, Birefringence, Phase Analysis
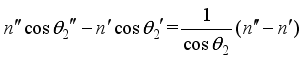
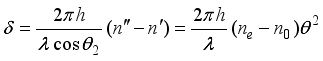
 denote angle of incidence and two refraction angles of ordinary ray and extraordinary ray, respectively.
  and
and  denote the wavelength of two refracted waves, respectively, where
  and
and  are the refractive indices of ordinary ray and extraordinary ray in a crystal.
 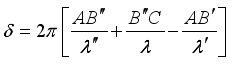 (1)
(1)  (2)
(2)  (3)
(3)  (4)
(4)  as
as  and
and  from refraction law, we obtain the following relations.
 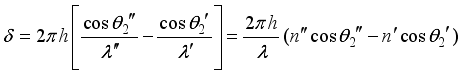 (5)
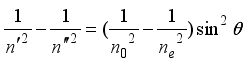
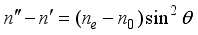
(5)  is given approximately as the following equation.
 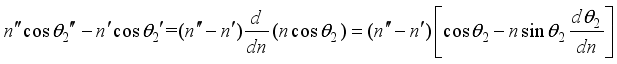 (6)
(6)  and
and  ,
,  is mean value of
  and
and  . Differentiating refraction law
 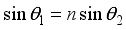 by assuming
  constant, we have the following equation.
 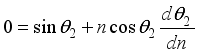 (7)
(7)  (8)
(8) 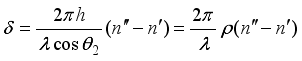 (9)
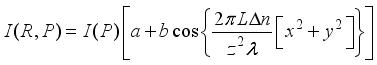
(9) 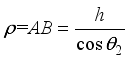 means the average value of the geometric path inside the crystal plate of two rays.
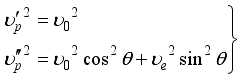
 is the phase velocity of the ordinary ray in the crystal,
  is the phase velocity of the extraordinary ray,
  is the velocity of the extraordinary ray in the direction of the optical axis in the crystal, and
  is the velocity of the extraordinary ray in the direction perpendicular to the optical axis.
 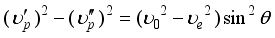 (10)
(10)  (11)
(11)  (12)
(12)  is the refractive index of the optical axis direction of extraordinary ray, and
  is the refractive index of the extraordinary ray in the direction perpendicular to the optical axis. Substituting this into equation (9), we obtain the following result.
 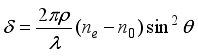 (13)
(13)  (14)
(14)  (15)
(15)  and
and  are 0.5.
 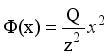 (16)
(16)  (17)
(17)  denote the coordinates corresponding to the maximal or minimal position of the intensity for a recorded fringe and let
  denote the corresponding phases, then the phase difference between two adjacent extremum points is 2π, we can write the following equation.
 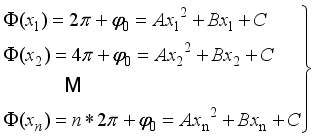 (18)
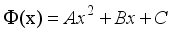
(18) 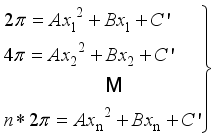 (19)
(19)  .
.  and x, and from this, we can find the distance.
  (20)
(20) BS | Beam Splitter |
FLPF | Fourier Low-Pass Filter |
MF | Median Filter |
| [1] | O. Yu Pikoul, Use of λ/4 phase plate in laser conoscopic method, Optik 161 (2018) 146–150. |
| [2] | O. Pikoul, Determination of the optical sign of a crystal by a conoscopic method, J. Appl. Cryst. 43 (2010) 949–954. |
| [3] | Sanjib Chatterjee, Y. Pavan Kumar, Simple technique for the generation of plane surface normal to optic axis direction of uniaxial crystal, Applied Optics, 46(9), 1435-1445 (2007). |
| [4] | L. Dumitrascu, I. Dumitrascu, D. O. Dorohoi, E. C. Subbarao, G. S. Hirane, F. Jona, Conoscopic method for determination of main refractive indices and thickness of a uniaxial crystal cut out parallel to its optical axis, J. Appl. Cryst. 42 (2009) 878–884. |
| [5] | F. E. Veiras, M. T. Garea, L. I. Perez, Wide angle conoscopic interference patterns in uniaxial crystals, Appl. Opt. 51 (2012) 3081–3090. |
| [6] | G. Y. Sirat, D. Psaltis, Conoscopic holograms, Opt. Commun. 65 (1998) 243–249. |
| [7] | N. V. Sidorov, A. A. Kruk, O. Y. Pikoul, M. N. Palatnikov, N. A. Teplyakova, A. A. Yanichev, O. V. Makarova, Integrated research of structural and optical homogeneities of the lithium niobate crystal with low photorefractive effect, Optik 126 (2015) 1081–1089. |
| [8] | O. Yu Pikoul, Visualization of light polarization forms in the laser conoscopic method, Optik 158 (2018) 349–354. |
| [9] | H. Guo, X. Weng, G. Sui, X. Dong, X. Gao, and S. Zhuang, Propagation of an arbitrary incident light in a uniaxially planar slab, Opt. Commun. 284, 5509–5512 (2011). |
| [10] | Verrier N, Atlan M. Off-axis digital hologram reconstruction: some practical considerations. Appl Opt 2011; 50(34): H136. |
| [11] | Zhong J, Weng J. Phase retrieval of optical fringe patterns from the ridge of a wavelet transform. Opt Lett 2005; 30(19): 2560. |
| [12] | Jie Li, Haiying Wu, Chun Qi, Complete description of the optical path difference of a novel spectral zooming imaging spectrometer, Opt. Commun 410 (2018) 598–603. |
| [13] | Y. Liu, H. Z. Jiang, L. Zhang, D. Li, X. Liu, and F. L. Zheng, Conoscopic polarized interference applied in measuring uniaxial axis direction of electro-optic crystal, Proc. SPIE 10155, 1015521 (2016). |
| [14] | D. Deng, C. Wei, K. Yi, J. Shao, Z. Fan, Y. Tian, Propagation properties of beam generated by Gaussian mirror resonator, Opt. Commun. 258 (2006) 43–50. |
| [15] | Schnars U, Juptner WP. Digital recording and numerical reconstruction of holograms. Inst Phys Publ 2002; 13: 17. |
| [16] | C. J. Holmes, S. L. Cornford, and J. R. Sambles, Conoscopic observation of director reorientation during Poiseuille flow of a nematic liquid crystal, Appl. Phys. Lett. 95, 171114 (2009), |
| [17] | M. Palatnikov, O. Pikoul, N. Sidorov, O. Makarova, K. Bormanis, Conoscopic studies of optical homogeneity of the LiNbO3: Mg crystals, Ferroelectrics 436 (2012) 19–28. |
| [18] | O. Yu Pikul, K. A. Rudoy, A. I. Livashvili, V. I. Doronin, V. I. Stroganov, Spiral structure in conoscopic figures of optically active crystals, J. Opt. Techn. 72 (2005) 69–70. |
APA Style
Choe, Y., Jang, G., Jong, Y., Choe, I. (2025). Interference Fringe Analysis for Precision Measurement by Using Conoscopic Interferometer. Optics, 13(1), 9-14. https://doi.org/10.11648/j.optics.20251301.12
ACS Style
Choe, Y.; Jang, G.; Jong, Y.; Choe, I. Interference Fringe Analysis for Precision Measurement by Using Conoscopic Interferometer. Optics. 2025, 13(1), 9-14. doi: 10.11648/j.optics.20251301.12
@article{10.11648/j.optics.20251301.12,
  author = {Yun-Bom Choe and Gyong-Song Jang and Yu-Song Jong and Il-Su Choe},
  title = {Interference Fringe Analysis for Precision Measurement by Using Conoscopic Interferometer
},
  journal = {Optics},
  volume = {13},
  number = {1},
  pages = {9-14},
  doi = {10.11648/j.optics.20251301.12},
  url = {https://doi.org/10.11648/j.optics.20251301.12},
  eprint = {https://article.sciencepublishinggroup.com/pdf/10.11648.j.optics.20251301.12},
  abstract = {In this paper, we propose a novel fringe phase analysis method that can quickly and accurately perform the interference fringe analysis for precise measurement by using a conoscopic interferometer. In general, interference fringe phase analysis is an important issue for the measurement using laser interference. Although many studies have been carried out on the conoscopic interferometer and its applications, no full-scale study has been carried out on the problem of the phase analysis of the interference fringes and shortening the time in the precision measurement using the conoscopic interferometer. This problem can be solved by an efficient fringe analysis method. In the conoscopic interferometer, the precision measurement was performed by measuring the change in the number of fringes due to the change in distance. This method has low accuracy and slow measurement speed. In this paper, we propose a novel method to quickly analyze the phase of the conoscopic interference fringe by means of the determination of the extremum points and briefly discuss the interference fringe filtering. Since the interference pattern obtained in the conoscopic interferometer is related to the distance, the analysis of the interference pattern gives the distance. The interference pattern can be simply analyzed since the phase difference between two adjacent extrema is 2π. The proposed method allows a simple and rapid analysis of the interferogram of the conoscopic interferometer, thus increasing the accuracy and speed of precision measurements using the conoscopic interferometer. The proposed fringe analysis method can be used not only for the analysis of the conoscopic interference fringe but also for other sorts of fringe analysis.
},
 year = {2025}
}
TY  - JOUR
T1  - Interference Fringe Analysis for Precision Measurement by Using Conoscopic Interferometer

AU  - Yun-Bom Choe
AU  - Gyong-Song Jang
AU  - Yu-Song Jong
AU  - Il-Su Choe
Y1  - 2025/06/20
PY  - 2025
N1  - https://doi.org/10.11648/j.optics.20251301.12
DO  - 10.11648/j.optics.20251301.12
T2  - Optics
JF  - Optics
JO  - Optics
SP  - 9
EP  - 14
PB  - Science Publishing Group
SN  - 2328-7810
UR  - https://doi.org/10.11648/j.optics.20251301.12
AB  - In this paper, we propose a novel fringe phase analysis method that can quickly and accurately perform the interference fringe analysis for precise measurement by using a conoscopic interferometer. In general, interference fringe phase analysis is an important issue for the measurement using laser interference. Although many studies have been carried out on the conoscopic interferometer and its applications, no full-scale study has been carried out on the problem of the phase analysis of the interference fringes and shortening the time in the precision measurement using the conoscopic interferometer. This problem can be solved by an efficient fringe analysis method. In the conoscopic interferometer, the precision measurement was performed by measuring the change in the number of fringes due to the change in distance. This method has low accuracy and slow measurement speed. In this paper, we propose a novel method to quickly analyze the phase of the conoscopic interference fringe by means of the determination of the extremum points and briefly discuss the interference fringe filtering. Since the interference pattern obtained in the conoscopic interferometer is related to the distance, the analysis of the interference pattern gives the distance. The interference pattern can be simply analyzed since the phase difference between two adjacent extrema is 2π. The proposed method allows a simple and rapid analysis of the interferogram of the conoscopic interferometer, thus increasing the accuracy and speed of precision measurements using the conoscopic interferometer. The proposed fringe analysis method can be used not only for the analysis of the conoscopic interference fringe but also for other sorts of fringe analysis.

VL  - 13
IS  - 1
ER  -
Department of Physics, University of Science, Pyongyang, Democratic People’s Republic of Korea
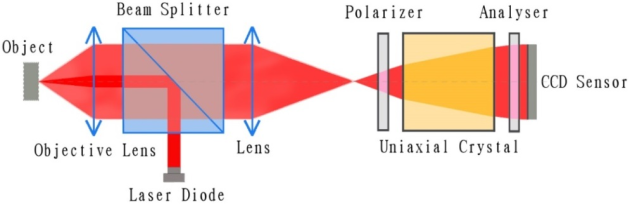
Figure 1. General Scheme of Conoscopic Interferometer.
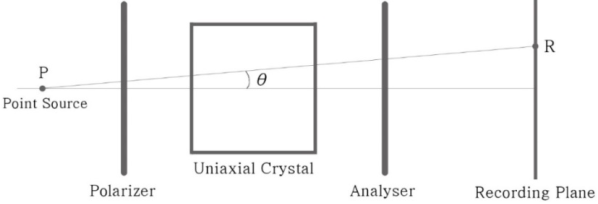
Figure 2. Schematic diagram of conoscopic interferometer.
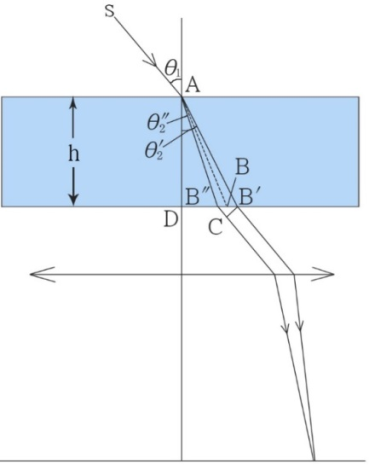
Figure 3. The optical path of ordinary ray and extraordinary ray emitted from parallel plate crystals.
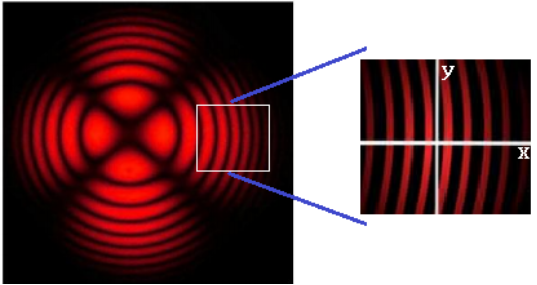
Figure 4. Interference fringe pattern used for phase analysis.
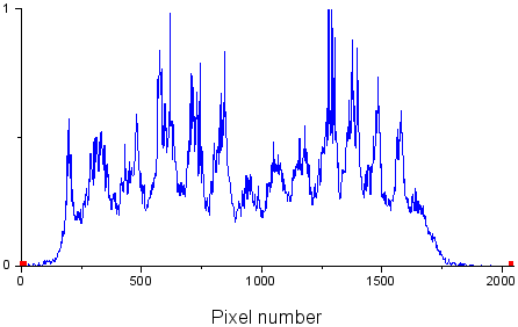
Figure 5. Interference fringes recorded on sensor.
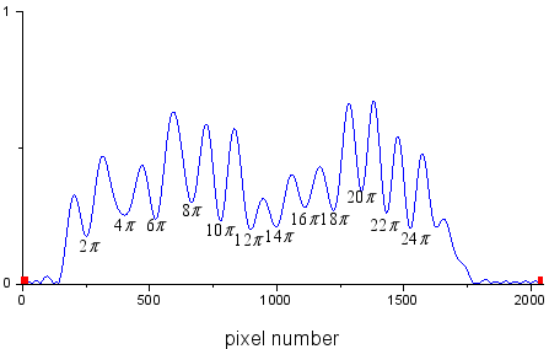
Figure 6. Filtered fringe patterns and detected minimum points (“o” points mean the detected minimum points.).
Information

