Research Article | | Peer-Reviewed

A Hybrid Intelligent Noise Pollution Prediction Model Based on ANFIS and Nature-Inspired Algorithms

Received: 11 April 2024     Accepted: 30 April 2024     Published: 17 May 2024
Views:       Downloads:
Abstract

In developing countries, researches in the areas of epidemiology, urban planning and environmental issues, it is extremely difficult to predict urban noise level in the neighborhoods. The majority of the noise-predicting algorithms in use today have limitations when it comes to prediction of noise level changes during intra-urban development and hence, the resulting noise pollution. Two hybrid noise prediction models, including ANFIS and PSO; and ANFIS and GA, were developed for Tarkwa Nsuaem Municipality and their performances were evaluated by applying statistical indicators. These hybrids were created to supplement and improve ANFIS's shortcomings based on their respective strengths and capabilities. To compare the performances of the models, statistical indicators were used; ANFIS-PSO performed better than the ANFIS-GA. The indications show the disparities, with the RMSE of ANFIS-PSO being 0.8789 and that of ANFIS-GA being 1.0529. Moreover, the Standard Deviation and Mean Square Error of ANFIS-PSO are 0.8898 and 0.7725 respectively, then those of ANFIS-GA are 1.0660 and 1.1086 respectively. A map showing the distribution of the predicted noise levels was produced from the outcome of the ANFIS-PSO model. Comparing the predicted noise levels to the EPA standards, it was observed that there is a danger which means people living in that area with noise levels above 65 dB are at high risk of health effects.

Published in American Journal of Mathematical and Computer Modelling (Volume 9, Issue 1)
DOI 10.11648/j.ajmcm.20240901.12
Page(s) 9-21
Creative Commons

This is an Open Access article, distributed under the terms of the Creative Commons Attribution 4.0 International License (http://creativecommons.org/licenses/by/4.0/), which permits unrestricted use, distribution and reproduction in any medium or format, provided the original work is properly cited.

Copyright

Copyright © The Author(s), 2024. Published by Science Publishing Group

Keywords

Noise Level Prediction, Noise Mapping, Dimensionality Reduction Techniques, Back Propagation Neural Network

1. Introduction
In urban areas, pollution from ambient noise is rising at a high rate. The main reason for this is due to the migration of people from various cultural backgrounds, social events, occupational activities, and infrastructure growth. Literature indicates that increasing exposure to excessive noise is associated with some health hazards like cardiovascular disease, ear disorders, hearing impairment, sleep disorders, irritation, and mental health problems . According to a World Health Organization (WHO) research, most of the global population is susceptible to loud noise levels that can result in hearing loss. Although using hearing protection is required and common in the advanced countries, the prevalence of hearing loss brought about by exposure to industrial noise is still astounding .
So far as human activities will continue to increase, noise pollution rates will inevitably continue to increase. In order to update the rates of noise pollution and forecast noise levels for effective urban planning and environmental protection management, in-depth study in this area of sound emissions must be done . Determining noise exposure risk at workplaces can help improve the safety of workers, thereby increasing effectiveness and productivity of workers. That can also contribute to an increase in industrial efficiency quality. In order to accurately measure and predict noise levels, long-term studies are required because noise emission exposure rates change depending on the working hours and environment .
The Lyons Empirical model, which is typically used for noise forecasting, has limitations when predicting long-term noise levels because it only accepts traffic noise as an input . Numerous studies have been carried out over time to develop models that can predict noise levels with definite accuracy. Some of these models include: Land-use Regression Model for estimating the exposure to pollution by noise , a hybrid approach and multiple linear regression used for accessing the noise exposure in urban areas , Regression Equation for modelling 10 percentile exceeded sound level (L10) as a function of traffic density , a computer model developed by for predicting noise levels produced by city traffic during periods of interrupted flow. Environmental noise pollution is currently predicted using artificial neural networks and fuzzy inference methods that can be applied to a variety of variables.
The ability of ANNs to characterize local features like discontinuity, value jumps, or other edges is limited, despite their success in modelling complicated nonlinear systems and signal prediction for different ranges of applications . The ANFIS, which combines ANN with fuzzy inference systems, has both the benefits and drawbacks of the two approaches in comparison to the other alternatives. ANFIS has an intelligent hybrid system, possesses self-learning capabilities and a reliable self-learning process and High nonlinearity, complexity, and discontinuity problems can be solved with this method, which also possesses high convergence rates, good stability, a repeatable training process, and high forecast accuracy . ANFIS has been proven to be another powerful tool in the non-linear system for modeling .
The practical implementation of the adaptive neural inference system contains flaws that have hindered its further promotion and implementation. These flaws are mostly seen in the difficulty in establishing the model structure and the high degree of randomness in the training parameter setting . Metaheuristic Algorithms (e.g., Particle Swarm Optimisation (PSO) or Genetic Algorithm (GA)) may therefore be used to compensate for ANFIS shortcomings. Combing ANFIS and PSO or ANFIS and GA normally help to improve the performance of the ANFIS. Hence, in this study, hybrid noise prediction models were developed using Adaptive Neuro-Fuzzy Inference System (ANFIS) and Metaheuristic Algorithms to enhance accurate environmental noise assessment and predictions.
2. Materials Methods Used
2.1. Area of Study
Tarkwa-Nsuaem Municipality (TNM) is located between Latitude 5° 17' North and 5° 19' North and Longitude 1° 59' West and 2° 00' West. It is approximately 85 km north of Takoradi, the regional capital of the Western Region of Ghana. Tarkwa-Nsuaem Municipality, under the Legislative Instrument (LI 1886) in 2007, was created from the former Wassa West District. It is bounded by Prestea Huni-Valley, Ahanta West, Mpohor Wassa East, and Nzema East to the north, south, east, and west respectively . Figure 1 shows the selected study area of TNM.
2.2. Methods Used
2.2.1. Adaptive Neuro-Fuzzy Inference System (ANFIS)
The ANFIS is a kind of ANN based on the fuzzy inference system Takagi-Sugeno . ANFIS is a hybrid, thus a synthesis of fuzzy logic and ANN that generates a strong processing device and compensates for its shortcomings as compared to the two methods . This conceptual model has two benefits: the former can easily convey human intelligence and the latter has the benefits of providing centralized information storage and learning capacities .
Since it incorporates neural networks as well as fuzzy logic concepts, it can reap the advantages of both in one single system. The inference method is compatible with a series of fuzzy ‘IF-THEN’ rules that have the capacity to estimate nonlinear functions such that the control can determine the relationship between input and output variables . As a predictive model, it can also be designed for conditions where data input and output are much uncertain. In such circumstances, the uncertainties of the data cannot be considered in classical methods of prediction .
ANFIS is made of five different layers. The first part of the layer takes the values of the input and determines the functions of each membership which belong to the system. It is generally termed a layer of fuzzification. The degrees of membership of each function are determined using the set of hypothesis parameters. The second layer is responsible for producing the regulatory firing strengths and is denoted as the rule layer. The function of third layer is to normalize the measured firing strengths by diving each value for the total firing power. The function of the fourth layer is to takes the normalized values and the specified parameter of consequence as data. The defuzzified values returned by this layer are those which are sent to the last layer to return the final output .
Figure 1. Tarkwa Nsuaem Municipality of Ghana.
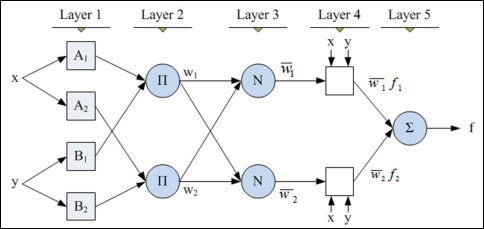
Figure 2. Structural Form of ANFIS.
2.2.2. ANFIS Training
In the MATLAB environment fuzzy system was implemented using subtractive clustering (Genfis 2) and FCM (Genfis 3). Parameters such as learning rate, error rate, and epochs were initiated in order for ANFIS to initiate its learning process. Metaheuristic optimization algorithms i.e., particle swarm optimization (PSO) and genetic algorithm (GA), were applied to ANFIS to extend its prediction proficiency and improve ANFIS performance and minimize the error rates by tuning and optimizing the membership functions of the Sugeno type fuzzy inference system. Specific parameters initialization for the GA and PSO were determined as displayed in Table 1. The process employed in training the ANFIS model using PSO and GA is demonstrated in Figure 2. The feed-forward equations of ANFIS are presented in Equations (1) to (5) as follows:
wi=μAi(x)×μBi(y),i=1, 2.(1)
w̅i= wi/(w1 + w2),i=1, 2.(2)
f1=p1x +q1y +r1z(3)
f2=p2x +q2y +r2z(4)
f=(w1f1+w2f2)/(w1 +w2)(5)
Where:
x and y = input variables
Ai and Bi = fuzzy sets
f = output
pi, qi, ri = consequent parameters
wi = weight
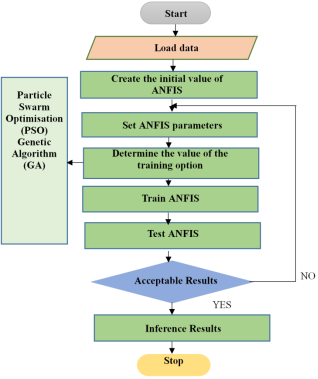
Figure 3. Process of ANFIS Training.
Table 1. Parameters of PSO and GA.

GA Parameters

PSO Parameters

Population Size

25.00

Population Size

25.00

Number of Iterations

6000

Number of Iterations

6000

Crossover Percentage

0.400

Inertia Weight

1.00

Mutation Percentage

0.700

Damping Ratio

0.9900

Mutation Rate

0.1500

Personal Learning coefficient

2.00

Selection Pressure

8.00

Global Learning coefficient

2.00

Gamma

0.700

Selection Function

Roulette Wheel

2.2.3. Particle Swarm Optimisation (PSO)
The PSO is a swarm intelligence-based, the random algorithm proposed by . This algorithm solves the optimal solution of different problems by migrating and collecting bird flock behaviors during phase foraging . PSO's basics include interconnection topologies, particle populations, evaluation rules, and search algorithms. Both are working together to find an optimal solution to the problem . PSO algorithm birds in the flock are symbolically represented as particles which are considered to be simple agents flying through a problem space.
One solution to the problem is the location of a suitable particle in a multi-dimensional problem space. A solution to another problem arises while a particle is travelling to a new position . This solution is determined by a fitness function, which gives the utility of the solution a quantitative value. The particle in the population has both an adaptable velocity (positional change) at which it travels in the search space and a memory that recalls the best location of the search space it has ever been to. Thus, the basic principle of PSO is to accelerate each particle toward the best individual in a topological neighborhood at each time with a random weighted acceleration .
The Particle in the PSO algorithm has a special position vector (Pi) and a velocity vector (vi) in the search region and inertia weight (w), the parameter that is used to monitor the current velocity of the previous velocities. First, the particles are initialized at random. And by repetition, the iterations bring about the best solution. Subsequently, individual pace of the particles is supposed to fly through the problem space solution and changes its flying velocity according to its own and social historical experiences to look for the globally optimal. The positions and velocities of each particle are modified by the two best positions at each learning period. The best solution is one that is found by the particle itself called personal best value (Pbest) and the other paramount is the best solution found by the whole swarm, called global best value (Gbest). Equation (6) is presented the particle velocity, and the particle location is provided in Equation (7).
Vit+1=a.Vit+c1.r1.pi-Xit+ c2.r2.(pg-Xit)(6)
Vit+1=Xit+Vit+1(7)
Where:
i = particle index
t = iteration number
Vi = displacement of particle’s movement
Vit = the current (previous) particle velocity
Vit+1 = the updated particle velocity
a = constriction coefficient
Vi = particle’s position within the problem domain
Xit = current particle position
c1 and c2 = two positive constants
r1 and r2 = are normalized unit random numbers in the range (0,1)
pi = individual best candidate solution for particle i
pg = a global best-candidate solution
2.2.4. Genetic Algorithm (GA)
Genetic Algorithm uses the natural selection rules of Darwin to obtain the optimal formula for matching patterns and this is also a good choice for the technique of random prediction . In GA solutions, the problem is randomly searched, and is done step by step. The quest is done to arrive at better solutions at each point and not just the previous one.
Genetic algorithm is capable of running in parallel which helps solve complex problems . In the algorithm search space, parameters are first formed in a type of chromosome called strings. This chromosome represents a problem-solving solution. The population is created by a set of chromosomes, and at the start of the operation, the initial determined population elements are usually randomly selected.
The developed algorithm certainly applies iteratively two specified crossover intersection and given mutation functions on population elements and produces a new population from another. Typically speaking, the solutions of a population are called generation. After the fixed repletion, suitable solutions are made for last-generation. To determine the optimality of each solution, an objective function is employed. The aim feature distributes a value to each one-generation population chromosome that determines the suitability of this solution, rather than the other same-generation solutions .
2.2.5. Evaluation of Performance of Developed Model Using Statistical Indicators
The accuracy of the developed models in this project was evaluated by computing statistical indicators with Equation (8) to Equation (10). The equations stipulated are given indicators that help to make an evaluation of the models. These include Mean Square Error (MSE), Root Mean Square Error (RMSE), and Standard Deviation (SD).
The MSE is a single value that provides information about the goodness of fit of the regression line and it is defined in Equation (8):
MSE=(x-x̅)2/N(8)
Where, x is the measured value, x̅ is the predicted value and N is the number of observation points.
The RMSE presents the accuracy of the model by comparing the deviation between predicted and measured noise levels. The value of RMSE is always positive and defined Equation (9):
RMSE=((x-x̅)2/N(9)
Where, x is the measured value, x̅ is the predicted value and N is the number of observation points. The Standard Deviation is also defined in Equation (10).
SD=(x-x̅2)/(N-1)(10)
The Standard Deviation (SD) thus calculated measures how closely the data are clustered around the mean, with N-1 being the degree of freedom, xthe measured value, and x̅ the predicted value.
3. Results and Discussion
3.1. Results
Table 2 and Table 3 show the errors propagated from the prediction of noise levels in Tarkwa Nsuaem Municipality (TNM) using both hybrid prediction models, thus, the ANFIS-PSO and the ANFIS-GA, as compared with the observed.
Table 2. Propagated Errors During Predictions of Noise Levels for Training Data.

Observed

Predicted (ANFIS-GA)

Error (ANFIS-GA)

Predicted (ANFIS-PSO)

Error (ANFIS-PSO)

65

65.41630058

-0.416300584

64.97278921

0.027210787

78

78.4861043

-0.4861043

78.00151625

-0.001516252

84

84.49948506

-0.499485065

84.03637167

-0.036371667

84

83.04865152

0.951348484

84.03222463

-0.032224632

75

76.28722363

-1.287223634

75.01033216

-0.010332155

86

85.12096869

0.879031308

85.98583698

0.014163017

88

88.28284329

-0.282843295

87.94040493

0.059595068

86

84.3623735

1.637626502

85.99976757

0.000232427

89

88.92903289

0.070967108

88.99890955

0.001090453

91

90.85825006

0.14174994

91.01874005

-0.018740052

98

98.16527733

-0.165277335

98.00282511

-0.002825113

96

96.11715327

-0.117153271

95.99065219

0.009347805

94

94.28806248

-0.288062477

93.99735276

0.002647244

83

83.32827922

-0.328279218

82.99639568

0.003604322

81

81.59110691

-0.591106909

80.98881564

0.01118436

85

85.03679159

-0.036791592

85.00341319

-0.003413193

75

74.85844092

0.141559081

75.00080234

-0.000802335

76

74.85844092

1.141559081

75.00080234

0.999197665

74

74.85844092

-0.858440919

75.00080234

-1.000802335

77

77.85876307

-0.858763074

77.66639021

-0.66639021

74

73.20485074

0.795149257

73.50058324

0.499416764

73

73.20485074

-0.204850743

73.50058324

-0.500583236

86

86.67737944

-0.677379445

85.99836246

0.001637539

84

84.08124288

-0.081242879

84.01744742

-0.017447423

89

92.17073144

-3.170731445

91.49931191

-2.499311914

87

85.48068017

1.519319826

86.99885897

0.001141027

90

91.66543967

-1.665439669

91.00564811

-1.005648113

95

95.60185074

-0.601850735

95.99949385

-0.999493847

98

96.9861982

1.013801796

96.99675252

1.00324748

97

95.60185074

1.398149265

95.99949385

1.000506153

87

87.10492428

-0.104924275

87.00235696

-0.00235696

89

88.09807936

0.901920636

89.02926001

-0.02926001

93

93.57288251

-0.57288251

93.9918187

-0.991818698

95

93.57288251

1.42711749

93.9918187

1.008181302

94

92.17073144

1.829268555

91.49931191

2.500688086

96

96.9861982

-0.986198204

96.99675252

-0.99675252

92

91.66543967

0.334560331

91.00564811

0.994351887

88

87.92515813

0.074841874

87.99772451

0.002275495

80

77.85876307

2.141236926

77.66639021

2.33360979

76

77.85876307

-1.858763074

77.66639021

-1.66639021

68

68.08943448

-0.089434479

67.99936318

0.000636823

Table 3. Errors Propagated During Predictions of Noise Levels for Testing Data.

Observed

Predicted (ANFIS-GA)

Error (ANFIS-GA)

Predicted (ANFIS-PSO)

Error (ANFIS-PSO)

79

78.4861043

0.5138957

78.00151625

0.998483748

85

84.3623735

0.637626502

85.99976757

-0.999767573

90

88.92903289

1.070967108

88.99890955

1.001090453

84

83.32827922

0.671720782

82.99639568

1.003604322

79

77.85876307

1.141236926

77.66639021

1.33360979

88

88.88167766

-0.881677663

88.82081692

-0.820816924

89

91.66543967

-2.665439669

91.00564811

-2.005648113

86

87.10492428

-1.104924275

87.00235696

-1.00235696

Figure 4 portrays the effective trend of noise levels generated by the hybrid models as compared to the observed (Target) using the training data. The green color indicates the observed noise level, the blue color represents the noise level predicted by ANFIS-GA and the yellow color also shows the noise level predicted by ANFIS-PSO.
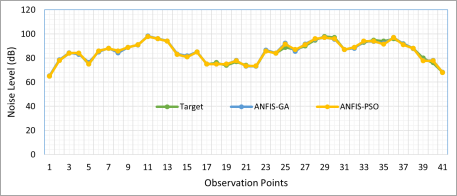
Figure 4. Trend of Noise Level Yielded by both Prediction Models for Training Data.
Figure 5 gives the presentation of normal trend of noise levels as developed by the hybrid models for prediction as compared to the observed (Target) using the testing data. The blue color indicates the observed noise level, the orange color represents the noise level predicted by ANFIS-GA and the ash color also shows the noise level predicted by ANFIS-PSO.
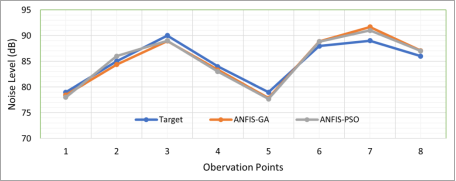
Figure 5. Trend of Noise Level Yielded by both Prediction Models for Testing Data.
Figure 6 gives the distinctive description of purported trend of errors that was generated by the prediction models using the training data. The blue color shows the error generated by ANFIS-GA and the orange color shows the error generated by ANFIS-PSO.
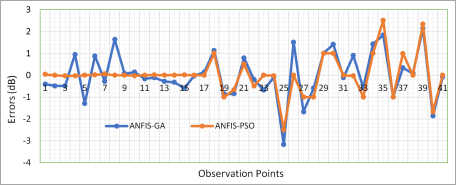
Figure 6. Errors Trend Generated from the Predictions Models for Training Data.
Figure 7 indicates error trend generated by both prediction models using the testing data. The blue color shows the error generated by ANFIS-GA and the orange color shows the error generated by ANFIS-PSO.
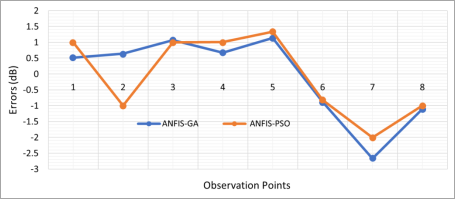
Figure 7. Error Trend Generated from the Predictions Models for Testing Data.
Based on the statistical analysis, the performance indicators of both hybrid models are presented in Tables 4 and 5 for the data used for training and the data for testing respectively. The performance indicators include RMSE, MSE, and SD, and these are compared for ANFIS-PSO and ANFIS-GA.
Table 4. Using Performance Indicators to Compare the Hybrid Models for Train Data.

Mathematical Model

Statistical Performance Indices

RMSE

MSE

SD

ANFIS-GA

1.0529

1.1086

1.0660

ANFIS-PSO

0.8789

0.7725

0.8898

Table 5. Using Performance Indicators to Compare the Hybrid Models for Test Data.

Mathematical Model

Statistical Performance Indices

RMSE

MSE

SD

ANFIS-GA

1.2587

1.5843

1.3431

ANFIS-PSO

1.1982

1.4357

1.2792

The indicated results achieved from the developed model (ANFIS-PSO) were utilized to plot the spatial distribution of the predicted noise levels of the study area. Figure 8 shows the map of the study area before the predictions and Figure 9 indicates the distribution of the predicted noise in the study area.
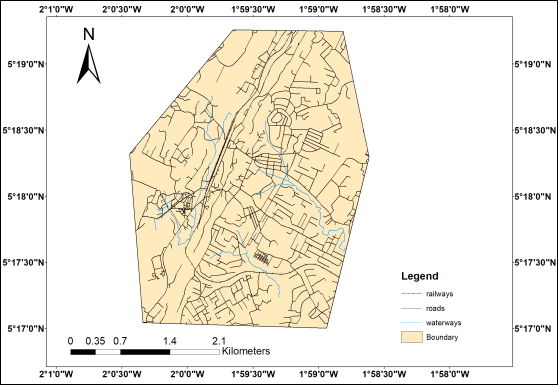
Figure 8. Area of Study before Prediction.
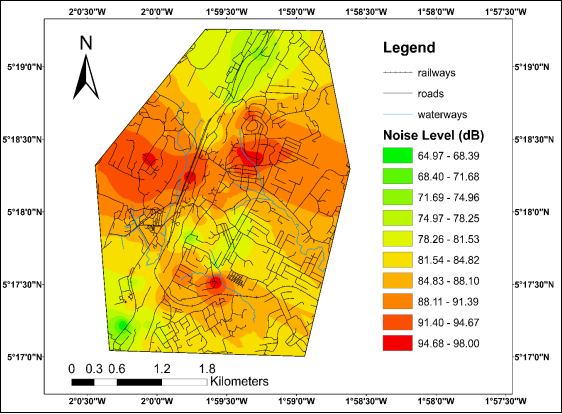
Figure 9. Area of Study after Prediction.
3.2. Analysis of Results
The degree of deviation of the errors between the predicted models and the corresponding measured training data and the testing data are indicated in Tables 1 and 2 respectively. The errors indicate that there are somehow prediction defects of the methods used in this research. The error propagation indicates the quantitative strength of the prediction of the methods used for the study. The aforementioned discuss could be verified from the analysis of Tables 1, 2, 3, 4, and Figures 1, 2, 3, and 4, where it was established that the ANFIS-PSO model gave more satisfactory results than the ANFIS-GA. This means that the ANFIS-PSO was then much able to replicate the measured noise data as in comparison with the ANFIS-GA. These predicted noise levels given by the ANFIS-PSO are in most suitable agreement with the measured field data of noise levels than the ANFIS-GA. This claim is further confirmed by Figure 3 and Figure 4, where it is noticed then that actual degree of error inconsistency for this hybrid, ANFIS-PSO, looks better as an indicator across the zero value than the ANFIS-GA.
It is established in literature that in order to determine the extent of best-fit of a model, the RMSE is a good estimator. In fact, RMSE shows the accuracy of the model by comparing the deviation between predicted and measured noise levels. Considering the results from Tables 3 and 4 for the training data and testing data respectively, however, it can be observed that the ANFIS-PSO brought out better performance in relation to the statistical indicators. Therefore, the nearer the RMSE value to zero the better the model prediction strength. Based on the condition of the RMSE results, it can be noticed that the ANFIS-PSO outperformed the ANFIS-GA. For the training data, the ANFIS-PSO had an RMSE of 0.8789 and the ANFIS-GA produced an RMSE of 1.0529. Again, for the testing data the ANFIS-PSO had an RMSE of 1.1982 and the ANFIS-GA produced an RMSE of 1.2587.
The SD, which presents how closely the data are clustered around the mean, has been confirmed by literature as another good estimator to determine the fit of a model. The precision capability of the models is established from the standard deviation values. For the training data, the ANFIS-PSO gave a Standard Deviation of 0.8898 and the ANFIS-GA had a Standard Deviation of 1.0660. Again, for the testing data the ANFIS-PSO had a Standard Deviation of 1.2792 and the ANFIS-GA had a Standard Deviation of 1.3431.
Moreover, the Mean Square Error (MSE) values presented in Tables 3 and 4 affirmed further the quality of the performance of the two methods used for the predictions. The MSE values from the results provide further information about the goodness of fit of the regression line. The MSE for ANFIS-PSO when the training data was used is 0.7725 and that of the ANFIS-GA is 1.1086. Again, when the testing data was initiated ANFIS-PSO gave MSE of 1.4357, and ANFIS-GA gave 1.5843.
There was a noise map which was developed from the predicted noise levels, that indicates that GIS could be a useful tool for mapping of noise. According to the presentation of Figure 6 the lowest predicted level of noise was 64.97 dB and the highest was 98.00 dB. According to the guidelines of EPA standards, an equivalent level of noise above 65 dB is ranked as much high indicating that people living in such environment are at high risk. People living in communities associated with high level of noise pollution brings them at risk of several health disorders including, sleep, ear impairment, psychological, sleep, behavioral disorder. Therefore, comparing the noise levels of Table 1 and Figure 6, it is obvious that that there may be a danger or adverse health effects on anyone who is staying in such communities. It is obvious from the gathered results that, whenever accurate data will be available these modern predicting models could be effective tools for assessment of noise exposure. Apparently, these maps are being used for urban planning, and environmental management, especially in areas where noise maps from competent authorities are not available.
4. Conclusion
Separate hybrid models for predicting noise (ANFIS-PSO and ANFIS-GA) have been created and their effectiveness assessed. Relying much on the capabilities of PSO and GA, the aforementioned hybrid models of ANFIS-GA and ANFIS-PSO were designed to boost the ineffectiveness of ANFIS and perfect them. Using statistical indices to well-define the performances of the created models, ANFIS-PSO outperformed the ANFIS-GA. This was clearly observed in the difference in the indicators of the calculated RMSE of ANFIS-PSO being 0.8789 and that of ANFIS-GA being 1.0529. Furthermore, the Standard Deviation and Mean Square Error of ANFIS-PSO are 0.8898 and 0.7725 respectively whiles that of ANFIS-GA are 1.0660 and 1.1086 respectively. A map showing the distribution of the predicted noise levels has been generated from the results of the ANFIS-PSO model. Comparing the predicted noise level to the EPA standards, it could be seen that there is a danger which means that people living in an area with a noise level above 65 dB are at high risk of health effects. These created hybrid models have enlightened researchers, planners and all stakeholders the ability of using them for urban planning, mapping noise to relate urban land use, helping in environmental noise management and planning.
Abbreviations
PSO: Particle Swarm Optimisation
GA: Genetic Algorithms
ANFIS: Adaptive Neuro-Fuzzy Inference System
Conflicts of Interest
The authors declare no conflicts of interest.
References
[1] Abraham, A. (2005), ‘Adaptation of Fuzzy Inference System Using Neural Learning’, Fuzzy Systems Engineering, Theory and Practice, Studies in Fuzziness and Soft Computing, Nedjah, Nadia, de Macedo Moureslle, Luiza (eds.), Germany, Springer Verlag, pp. 53–83.
[2] Aguilera, I., Foraster, M., Basagaña, X., Corradi, E., Deltell, A., Morelli, X., Phuleria, H. C., Ragettli, M. S., Rivera, M., Thomasson, A., Slama, R. and Künzli, N. (2014), ‘Application of Land Use Regression Modelling to Assess the Spatial Distribution of Road Traffic Noise in Three European Cities’, Journal of Exposure Science & Environmental Epidemiology, Vol. 25, No. 1, pp. 97–105.
[3] Alarifi, I. M., Nguyen, H. M., Naderi-Bakhtiyari, A. and Asadi, A. (2019), ‘Feasibility of ANFIS-PSO and ANFIS-GA Models in Predicting Thermophysical Properties of Al2O3-MWCNT/Oil Hybrid Nanofluid’, Materials, Vol. 12, No. 21, pp. 3628-3639.
[4] Arevalo, P., Cano, A. and Jurabo, F. (2024), “Large Scale Integration of Renewable Energies by 2050 Through Demand Prediction with ANFIS, Ecuador Case Study”, Energy Journal, Vol. 286 (10), pp. 234-256.
[5] Baffoe, P. E. and Duker, A. A. (2019a), ‘Evaluation of Two Noise Level Prediction Models: Multiple Linear Regression and a Hybrid Approach’, American Journal of Mathematical and Computer Modelling, Vol. 4, No. 3, pp. 91-99.
[6] Baffoe, P. E. and Duker, A. A. (2019b), ‘Application of Multiple Linear Regression Technique to Predict Noise Pollution Levels and Their Spatial Patterns in the Tarkwa Mining Community of Ghana’, American Journal of Mathematical and Computer Modelling, Vol. 4, No. 2, pp. 36-44.
[7] Duranoglu, D., Sinan, A. and Ilkmiv, K. (2024), “Optimization of Adaptive Neuro-Fuzzy Inference Systems (ANFIS) Parameters via Box Behnken Experimental Design Approach: The Prediction of Chromium Adsorption”, Heliyon Journal, Vol. 1016 (10), pp. 30-55.
[8] Fan, B., Lin, C., Wang, F., Liu, S., Liu, L. and Xu, S. (2018), ‘An Adaptive Neuro-Fuzzy Inference System (ANFIS) Based Model for the Temperature Prediction of Lithium-Ion Power Batteries’, SAE International Journal of Passenger Cars - Electronic and Electrical Systems, Vol. 12, No. 1, pp. 187–199.
[9] Gandomi, A. H., Yun, G. J., Yang, X. S., and Talatahari, S. (2013), 'Chaos-Enhanced Accelerated Particle Swarm Optimization', Communications in Nonlinear Science and Numerical Simulation, Vol. 18, No. 2, pp. 327–340.
[10] Gao, W., Moayedi, H. and Shahsavar, A. (2019), ‘The Feasibility of Genetic Programming and ANFIS in Prediction Energetic Performance of a Building Integrated Photovoltaic Thermal (BIPVT) System’, Solar Energy, Vol. 183, pp. 293–305.
[11] Golmohammadi, R., Abolhasannejad, V., Soltanian, A. R., Mohsen, A. and Khotanlou, H. (2018), ‘Noise Prediction in Industrial Workrooms Using Regression Modelling Methods Based on the Dominant Frequency Cut-off Point’, Australian Acoustical Society, Vol. 46, pp. 269-280.
[12] Jang, J. S. R. (1993), ‘ANFIS: Adaptive-Network-Based Fuzzy Inference System’, IEEE Transactions on Systems, Man and Cybernetics, Vol. 23, No. 3, pp. 665–685.
[13] Karaboga, D. and Kaya, E. (2019), ‘Adaptive Network Based Fuzzy Inference System (ANFIS) Training Approaches: A Comprehensive Survey’, Artificial Intelligence Review, Vol. 52, pp. 2263–2293.
[14] Kennedy, J. and Eberhart, R. (1995), ‘Particle swarm optimization’, Proceedings of the IEEE International Conference on Neural Networks, Perth, WA, Australia, pp. 1942–1948.
[15] Li, F., Xue, W., Rong, Y., Du, C., Tang, J., and Zhao, Y. (2022), ‘A Probability Distribution Prediction Method for Expressway Traffic Noise’, Journal of Transport and Environment, Vol. 103, pp. 103175.
[16] Liu, X. and Zhou, Z. (2017), ‘A Novel Prediction Model Based on Particle Swarm Optimization and Adaptive Neuro-Fuzzy Inference System’, Journal of Intelligent and Fuzzy Systems, Vol. 33, No. 5, pp. 3137-3143.
[17] Mikaeil, R., Piri, M., Shaffiee Haghshenas, S., Careddu, N., Hashemolhosseini, H. (2022), ‘An Experimental-Intelligent Method to Predict Noise Value of Drilling in Dimension Stone Industry’, Journal of Mining, Vol. 13, pp. 693–713.
[18] Mensah, P. (2018), ‘A Hybrid Model of Principal Component Analysis and Back Propagation Neural Network for Noise Prediction’, Unpublished BSc Project Report, University of Mines and Technology, Tarkwa, 38pp.
[19] Naqvi, S. L. H., Ayub, F., Yasar, A., Tabinda, A. B., Nawaz, H., and Tanver, R. (2023), ‘Pollution Status Monitoring and Indices Development for Evaluating Sustainable Environmental Management Practices (SEMP) in Quaid-E-Azam Industrial Estate, Pakistan’, Journal of Cleaner Production, Vol. 45, pp. 124-139.
[20] Nobile, M. S., Cazzaniga, P., Besozzi, D., Colombo, R., Mauri, G. and Pasi, G. (2018), ‘Fuzzy Self-Tuning PSO: A Settings-Free Algorithm for Global Optimization’, Swarm and Evolutionary Computation, Vol. 39, pp. 70–85.
[21] Radwan, M. M., and Oldham, D. J. (1987), 'The Prediction of Noise from Urban Traffic Under Interrupted Flow Conditions. Applied Acoustics, Vol. 21, No. 2, pp. 163–185.
[22] Rao, P. and Rao, S. (1991), ‘Prediction of LAT Traffic Noise Levels in the City of Visakhapatnam India’, Applied Acoustics, Vol. 34, pp. 101–110.
[23] Sharifi, A., Harati, A. and Vahedian, A. (2017), ‘Marker-Based Human Pose Tracking Using Adaptive Annealed Particle Swarm Optimization with Search Space Partitioning’, Image Vision Computing, Vol. 62, pp. 28–38.
[24] Singh, D., Francavilla, A. B., Mancini, S., and Guarnaccia, C. (2021), ‘Application of Machine Learning to Include Honking Effect in Vehicular Traffic Noise Prediction’, Applied Sciences, Vol. 11 (13), pp. 6030-6046.
[25] Singh, D., Upadyay, R., Singh, H. P., and Leray, D. (2021), ‘Development of an Adaptive Neuro Fuzzy Inference System Based Vehicular Traffic Noise Prediction Model’, Journal of Ambient Intelligence and Humanized Computing, Vol. 12, pp. 2685-2701.
[26] Yadav, A., Mandhani, I., Porida, M., and Kumar, B. (2022), ‘Modelling Traffic Noise in the Vicinity of Urban Road Intersections’, Journal of Transport and Environment, Vol. 112, pp. 1-16.
[27] Zafar, M., Aggarwal A., Rene, E. R., Barbusinski, K., Mahanty, B., Behera, S. K. (2022), “Data-driven Machine Learning Intelligent Tools for Predicting Chromium Removal in an Adsorption System. Processes. 2022; 10: 447.
[28] Zhang, K., Hu, Z., Gan, X. T. and Fang, J. B. (2016), ‘A Network Traffic Prediction Model Based on Quantum-Behaved Particle Swarm Optimization Algorithm and Fuzzy Wavelet Neural Network’, Discrete Dynamics in Nature and Society, Vol. 2016, pp. 1-11.
[29] Zhang, L., Liu, J., Lai, J. and Xiong, Z. (2014), ‘Performance Analysis of Adaptive Neuro Fuzzy Inference System Control for MEMS Navigation System’, Mathematical Problems in Engineering, Vol. 2014, pp. 1–7.
[30] Zhang, Z., Al-Bahrani M., Ruhani B., Ghalehsalimi H. H., Ilghani N. Z., Maleki, H., Ahmad, N., Nasajpour-Esfahani, N., Toghraie, D. (2023), “Optimized ANFIS Models Based on Grid Partitioning, Subtractive Clustering, and Fuzzy C-means to Precise Prediction of Thermophysical Properties of Hybrid Nanofluids. Chem. Eng. J. 2023; 471.
Cite This Article
  • APA Style

    Baffoe, P. E., Boye, C. B. (2024). A Hybrid Intelligent Noise Pollution Prediction Model Based on ANFIS and Nature-Inspired Algorithms. American Journal of Mathematical and Computer Modelling, 9(1), 9-21. https://doi.org/10.11648/j.ajmcm.20240901.12

    Copy | Download

    ACS Style

    Baffoe, P. E.; Boye, C. B. A Hybrid Intelligent Noise Pollution Prediction Model Based on ANFIS and Nature-Inspired Algorithms. Am. J. Math. Comput. Model. 2024, 9(1), 9-21. doi: 10.11648/j.ajmcm.20240901.12

    Copy | Download

    AMA Style

    Baffoe PE, Boye CB. A Hybrid Intelligent Noise Pollution Prediction Model Based on ANFIS and Nature-Inspired Algorithms. Am J Math Comput Model. 2024;9(1):9-21. doi: 10.11648/j.ajmcm.20240901.12

    Copy | Download

  • @article{10.11648/j.ajmcm.20240901.12,
      author = {Peter Ekow Baffoe and Cynthia Borkai Boye},
      title = {A Hybrid Intelligent Noise Pollution Prediction Model Based on ANFIS and Nature-Inspired Algorithms
    },
      journal = {American Journal of Mathematical and Computer Modelling},
      volume = {9},
      number = {1},
      pages = {9-21},
      doi = {10.11648/j.ajmcm.20240901.12},
      url = {https://doi.org/10.11648/j.ajmcm.20240901.12},
      eprint = {https://article.sciencepublishinggroup.com/pdf/10.11648.j.ajmcm.20240901.12},
      abstract = {In developing countries, researches in the areas of epidemiology, urban planning and environmental issues, it is extremely difficult to predict urban noise level in the neighborhoods. The majority of the noise-predicting algorithms in use today have limitations when it comes to prediction of noise level changes during intra-urban development and hence, the resulting noise pollution. Two hybrid noise prediction models, including ANFIS and PSO; and ANFIS and GA, were developed for Tarkwa Nsuaem Municipality and their performances were evaluated by applying statistical indicators. These hybrids were created to supplement and improve ANFIS's shortcomings based on their respective strengths and capabilities. To compare the performances of the models, statistical indicators were used; ANFIS-PSO performed better than the ANFIS-GA. The indications show the disparities, with the RMSE of ANFIS-PSO being 0.8789 and that of ANFIS-GA being 1.0529. Moreover, the Standard Deviation and Mean Square Error of ANFIS-PSO are 0.8898 and 0.7725 respectively, then those of ANFIS-GA are 1.0660 and 1.1086 respectively. A map showing the distribution of the predicted noise levels was produced from the outcome of the ANFIS-PSO model. Comparing the predicted noise levels to the EPA standards, it was observed that there is a danger which means people living in that area with noise levels above 65 dB are at high risk of health effects.
    },
     year = {2024}
    }
    

    Copy | Download

  • TY  - JOUR
    T1  - A Hybrid Intelligent Noise Pollution Prediction Model Based on ANFIS and Nature-Inspired Algorithms
    
    AU  - Peter Ekow Baffoe
    AU  - Cynthia Borkai Boye
    Y1  - 2024/05/17
    PY  - 2024
    N1  - https://doi.org/10.11648/j.ajmcm.20240901.12
    DO  - 10.11648/j.ajmcm.20240901.12
    T2  - American Journal of Mathematical and Computer Modelling
    JF  - American Journal of Mathematical and Computer Modelling
    JO  - American Journal of Mathematical and Computer Modelling
    SP  - 9
    EP  - 21
    PB  - Science Publishing Group
    SN  - 2578-8280
    UR  - https://doi.org/10.11648/j.ajmcm.20240901.12
    AB  - In developing countries, researches in the areas of epidemiology, urban planning and environmental issues, it is extremely difficult to predict urban noise level in the neighborhoods. The majority of the noise-predicting algorithms in use today have limitations when it comes to prediction of noise level changes during intra-urban development and hence, the resulting noise pollution. Two hybrid noise prediction models, including ANFIS and PSO; and ANFIS and GA, were developed for Tarkwa Nsuaem Municipality and their performances were evaluated by applying statistical indicators. These hybrids were created to supplement and improve ANFIS's shortcomings based on their respective strengths and capabilities. To compare the performances of the models, statistical indicators were used; ANFIS-PSO performed better than the ANFIS-GA. The indications show the disparities, with the RMSE of ANFIS-PSO being 0.8789 and that of ANFIS-GA being 1.0529. Moreover, the Standard Deviation and Mean Square Error of ANFIS-PSO are 0.8898 and 0.7725 respectively, then those of ANFIS-GA are 1.0660 and 1.1086 respectively. A map showing the distribution of the predicted noise levels was produced from the outcome of the ANFIS-PSO model. Comparing the predicted noise levels to the EPA standards, it was observed that there is a danger which means people living in that area with noise levels above 65 dB are at high risk of health effects.
    
    VL  - 9
    IS  - 1
    ER  - 

    Copy | Download

Author Information