1. Introduction
Globalization has spurred economic growth but also led to excessive resource consumption and environmental pollution. Since the onset of industrialization, global greenhouse gas emissions have steadily risen. According to data from the Our World in Data website, global greenhouse gas emissions reached 53.82 billion tons in 2023
. This increase has not only heightened the risk of climate change but also intensified the pressure on global environmental protection efforts. As a result, promoting green transformation, reducing carbon emissions, and achieving sustainable development have emerged as urgent challenges that require immediate attention from countries worldwide. In this context, energy transformation is recognized as a central component in the pursuit of sustainable development. The International Energy Agency (IEA) emphasizes that achieving net-zero emissions by 2050 and limiting the global temperature increase to 1.5°C requires closing the gap between rhetoric and tangible actions while expediting the energy transition process
. However, there are significant disparities in the progress made by different countries and regions in enhancing energy efficiency and protecting the environment. Compared to developed nations, many developing countries face challenges such as financial constraints and technological limitations, resulting in a relatively slow pace of energy transition. Consequently, establishing an effective assessment mechanism to measure the progress and effectiveness of the green energy transition is paramount.
To address these challenges, promoting a green transition has become a critical priority for countries worldwide. Among various strategies, energy transformation is fundamental to achieving sustainable development. However, significant disparities exist in the performance of different countries and regions regarding energy efficiency and environmental protection.
Methods for measuring energy efficiency primarily fall into two categories: single-variable measurement, such as assessing energy efficiency by the ratio of energy consumption per unit of GDP
| [3] | Brockway, P. E., Sorrell, S., Semieniuk, G., Heun, M. K., Court, V. Energy efficiency and economy-wide rebound effects: A review of the evidence and its implications. Renewable and Sustainable Energy Reviews. 2021, 141, 110781. https://doi.org/10.1016/j.rser.2021.110781 |
[3]
, and comprehensive variable measurement, which involves a more holistic approach by incorporating multiple factors
. In 2006, Hu and Wang introduced the concept of Total Factor Energy Efficiency (TFEE), emphasizing that improvements in energy efficiency are inherently linked to advancements in total factor productivity. This concept incorporates key input factors such as capital and labor, providing a more holistic approach to evaluating energy efficiency performance
. Building upon this foundation, Green Total Factor Energy Efficiency (GTFEE) emerged as an extension of TFEE, serving as a pivotal indicator for assessing progress in green energy transitions.
Unlike traditional energy efficiency (EE) indicators, GTFEE adopts a more comprehensive approach. The calculation methods for GTFEE primarily include four: the algebraic exponential method, the Solow residual method, the stochastic frontier production function method, and the data envelopment analysis (DEA) method
| [6] | Wu, H., Hao, Y., Ren, S., Yang, X., Xie, G. Does internet development improve green total factor energy efficiency? Evidence from China. Energy Policy. 2021, 153, 112247. https://doi.org/10.1016/j.enpol.2021.112247 |
[6]
. Among these, DEA has become the most widely used method for efficiency evaluation due to its ability to assess the relative efficiency of decision-making units under conditions of multiple inputs and outputs. These methods allow for the consideration of multiple inputs (such as labor, capital, and energy) and multidimensional outputs (such as economic output and pollution emissions). As a result, GTFEE not only captures the relationship between energy consumption and economic growth but also provides a holistic assessment of the negative environmental impacts of emissions. This characteristic makes GTFEE a valuable tool in evaluating the role of green technology innovation and energy policies in driving environmental benefit transformations.
As a crucial tool for measuring green development and energy transformation, GTFEE has been widely applied across various fields. For instance, GTFEE is commonly used to assess regional disparities in energy efficiency, analyze efficiency changes before and after policy implementation
, and investigate the impact of technological progress on energy efficiency
. Moreover, GTFEE provides a scientific foundation for policymakers, offering insights to help regions minimize resource waste and environmental pollution while promoting economic growth
| [9] | Hao, Y., Gai, Z., Wu, H. How do resource misallocation and government corruption affect green total factor energy efficiency? Evidence from China. Energy Policy. 2020, 143, 111562. https://doi.org/10.1016/j.enpol.2020.111562 |
[9]
. Although GTFEE has been widely studied across various fields, including the construction of comprehensive indicators and the examination of factors such as Internet development
| [6] | Wu, H., Hao, Y., Ren, S., Yang, X., Xie, G. Does internet development improve green total factor energy efficiency? Evidence from China. Energy Policy. 2021, 153, 112247. https://doi.org/10.1016/j.enpol.2021.112247 |
[6]
, environmental regulation
| [10] | Wu, H., Hao, Y., Ren, S. How do environmental regulation and environmental decentralization affect green total factor energy efficiency: Evidence from China. Energy Economics. 2020, 91, 104880. https://doi.org/10.1016/j.eneco.2020.104880 |
[10]
, and new urbanization
, existing literature has predominantly focused on individual countries or specific industries (e.g., the GTFEE analysis of China’s manufacturing sector)
| [12] | Chen, Y., Lin, B. Understanding the green total factor energy efficiency gap between regional manufacturing—insight from infrastructure development. Energy. 2021, 237, 121553. https://doi.org/10.1016/j.energy.2021.121553 |
[12]
, with most studies analyzing the impact of a single variable on GTFEE from a singular perspective. There is a lack of systematic research that comprehensively compares the effects of multiple factors on GTFEE.
Green Total Factor Energy Efficiency (GTFEE) is a key indicator for evaluating the green energy transition, offering a comprehensive reflection of a country’s performance in green technology innovation, energy use efficiency, and environmental protection. Unlike traditional energy efficiency (EE) metrics, GTFEE goes beyond assessing the impact of energy consumption on economic growth by also incorporating environmental pollution factors. This broader approach provides a more holistic perspective for evaluating the role of green technologies and energy policies in driving environmental benefits and fostering sustainable development.
Since its establishment in 1961, the Organization for Economic Co-operation and Development (OECD) has been dedicated to promoting economic growth and improving living standards among its member countries. These countries hold a significant position in the global economy, and their green transition policies have far-reaching impacts worldwide. In recent years, several OECD countries have shifted toward a less energy-intensive service sector model, leading to a reduction in overall energy intensity. For instance, their energy intensity decreased from 5.22 megajoules (MJ) per unit of GDP in 2000 to 4.13 MJ in 2014
| [13] | Paramati, S. R., Shahzad, U., Doğan, B. The role of environmental technology for energy demand and energy efficiency: Evidence from OECD countries. Renewable and Sustainable Energy Reviews. 2022, 153, 111735. https://doi.org/10.1016/j.rser.2021.111735 |
[13]
. As such, assessing the GTFEE of OECD countries not only helps evaluate their progress in the green transition but also provides valuable insights for global green development.
However, the existing literature reveals a gap in the study of the long-term trends of GTFEE across the 38 OECD countries. On one hand, most studies focus on GTFEE assessment at a specific point in time or over a short period and fail to cover all 38 OECD member countries, thus missing the dynamic characteristics of its changes
| [14] | Sun, X. Analysis of green total factor productivity in OECD and BRICS countries: based on the Super-SBM model. Journal of Water and Climate Change. 2022, 13, 3400–15. https://doi.org/10.2166/wcc.2022.149 |
| [15] | Erkul, A., Türköz, K. Green growth governance and total factor energy efficiency: Economic growth constraint and policy implementation in OECD countries. Renewable Energy. 2024, 235, 121278. https://doi.org/10.1016/j.renene.2024.121278 |
[14, 15]
. On the other hand, existing research often examines the impact of a few key variables on GTFEE without systematically comparing the effects of multiple factors. To address these research gaps, this study employs the super-efficiency SBM-DEA model to measure the changing trends of GTFEE for the 38 OECD countries from 1995 to 2021. It systematically evaluates the impact of multidimensional factors, including technological innovation, the proliferation of information and communication technology (ICT), the level of economic development, and the optimization of energy structure, on GTFEE, and assesses the relative importance of each factor. By expanding the time dimension, geographical scope, and variable selection, this study offers a new perspective on global green development research.
The structure of the paper is as follows: Section 2 outlines the logic behind the selection of variables and research methods; Section 3 presents the GTFEE measurement results and provides an in-depth analysis of the influencing factors and their relative significance; and Section 4 summarizes the findings and offers corresponding policy recommendations.
Although GTFEE has been widely studied across various fields, including the construction of comprehensive indicators and the examination of factors such as Internet development, environmental regulation, new urbanization, and technological innovation, existing literature has predominantly focused on individual countries or specific industries (e.g., the GTFEE analysis of China’s manufacturing sector). Consequently, there remains a lack of analytical studies examining the trends of GTFEE changes over an extended period in 38 OECD countries. This paper addresses this re-search gap by measuring the GTFEE trends of 38 OECD countries from 1995 to 2021 using the super-efficient SBM-DEA model. The structure of the paper is as follows: Section 2 outlines the variable selection and research meth-odology; Section 3 presents the results of the GTFEE measurement; Section 4 analyzes the influencing factors of GTFEE, highlighting the significance of each factor; and Section 5 summarizes the findings of the study.
2. Data and Methodology
The aim of this study is to assess the GTFEE and its potential influencing factors in 38 OECD countries over the period from 1995 to 2021. This section outlines the selection of variables and the data sources used in this study.
2.1. Indicators Selection and Data Source
First, regarding the construction of the core explanatory variable-GTFEE. Referring to the previously mentioned studies, this study selects labor force, gross fixed capital formation, and total energy consumption as input variables. Real GDP is used as the desired output, while CO
2 emissions are considered as the non-desired output.
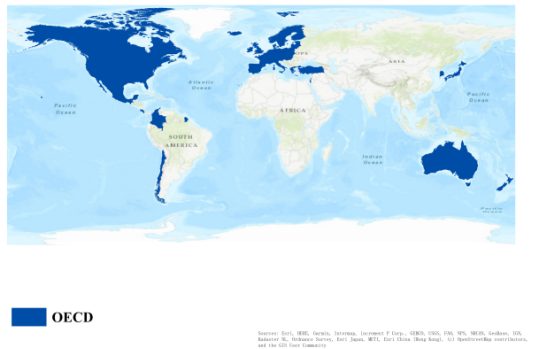
Table 1 presents the input-output indicators for GTFEE based on the super-efficiency SBM-DEA model and the selection of potential covariates. All data are logarithmized to eliminate the scale effect and ensure comparability across different variables. The data sources include the World Bank and the International Energy Agency (IEA) databases, covering 38 OECD countries from 1995 to 2021. These countries are categorized into three regional groups: OECD Americas (Canada, Chile, Colombia, Costa Rica, Mexico, and the United States), OECD Asia-Oceania (Australia, Israel, Japan, South Korea, and New Zealand), and OECD Europe (Austria, Czech Republic, Estonia, Belgium, Denmark, Finland, France, Germany, Greece, Hungary, Iceland, Italy, Latvia, Lithuania, Luxembourg, Netherlands, Norway, Poland, Portugal, Spain, Sweden, Switzerland, Slovakia, Turkey, Ireland, Slovenia, and the United Kingdom).
Then, in this study, the following variables are selected as influencing factors to examine their potential impact on GTFEE.
Technological innovation is a crucial factor in enhancing energy efficiency and facilitating the green transition. Innovation-driven technologies are particularly effective in improving resource utilization efficiency, especially within the renewable energy and energy-saving sectors
| [16] | Chen, W., Zou, W., Zhong, K., Aliyeva, A. Machine learning assessment under the development of green technology innovation: A perspective of energy transition. Renewable Energy. 2023, 214, 65–73. https://doi.org/10.1016/j.renene.2023.05.108 |
[16]
. Therefore, technological innovation is chosen as a core variable to investigate its impact on GTFEE.
The telecommunication level plays a vital role in facilitating the dissemination of information, the diffusion of technology, and improving energy utilization efficiency. As information technology advances, expanding communication networks enhances energy management and resource allocation efficiency
| [17] | Mao, W., Zhao, Z., Chang, Z., Min, G., Gao, W. Energy-Efficient Industrial Internet of Things: Overview and Open Issues. IEEE Trans Ind Inf. 2021, 17, 7225–37. https://doi.org/10.1109/TII.2021.3067026 |
[17]
. For this reason, telecommunication level is included as a variable in this study.
The level of
energy intensity (primary energy) directly reflects the energy consumption per unit of GDP in a region, with lower energy intensity typically indicating higher energy utilization efficiency. This variable effectively captures the relationship between energy consumption and economic growth
| [18] | Danish, U., Ulucak, R., Khan, S. Relationship between energy intensity and CO2 emissions: Does economic policy matter? Sustainable Development. 2020, 28, 1457–64. https://doi.org/10.1002/sd.2098 |
[18]
, making it a crucial factor in influencing GTFEE.
The optimization of the
energy structure, particularly the increase in the share of clean energy, plays a critical role in reducing carbon emissions from energy consumption and promoting sustainable national development
. As the world transitions to a low-carbon economy, the adjustment of the energy structure has become a key driver of improved GTFEE. Therefore, this variable has been selected for inclusion in this study.
Foreign direct investment (FDI)
The level of
economic development is a fundamental determinant of resource allocation, technological development, and energy efficiency, and higher levels of economic development usually imply greater technological innovation and higher investment in green development
| [21] | Tachega, M. A., Chen, Y., Agbanyo, G. K., Ahmed, R., Appiah, A., Mintah, C. Energy efficiency, economic growth, and natural resource rent: A trilemma analysis of environmental sustainability in Africa. Energy. 2024, 307, 132693. https://doi.org/10.1016/j.energy.2024.132693 |
[21]
.
Changes in
industrial structure, particularly the increase in the proportion of the tertiary industry, are typically associated with higher energy efficiency and lower energy consumption
| [22] | Su, Y., Fan, Q. Renewable energy technology innovation, industrial structure upgrading and green development from the perspective of China’s provinces. Technological Forecasting and Social Change. 2022, 180, 121727. https://doi.org/10.1016/j.techfore.2022.121727 |
[22]
. As the service sector grows, the optimization of industrial structure becomes a key factor in improving energy efficiency. Therefore, this variable is included in the scope of this study.
The fiscal level (Tax) reflects the extent of government financial support for areas such as green technology and energy transition. Higher fiscal spending fosters green investment and technology research and development, which in turn enhances the region's GTFEE
| [23] | Sun, Y., Guan, W., Razzaq, A., Shahzad, M., Binh An, N. Transition towards ecological sustainability through fiscal decentralization, renewable energy and green investment in OECD countries. Renewable Energy. 2022, 190, 385–95. https://doi.org/10.1016/j.renene.2022.03.099 |
[23]
. Therefore, fiscal level is considered a crucial influencing factor in this study.
Increased
urbanization is generally associated with higher energy efficiency and enhanced technological innovation. As urbanization advances, cities typically exhibit improved energy management and technological progress
. Therefore, this variable has been chosen to examine its potential impact on GTFEE.
Tariff policies play a significant role in shaping a country’s trade environment, domestic market competitiveness, and resource allocation efficiency. A high proportion of tariff revenue often indicates elevated trade barriers
, which can hinder efficient resource allocation or delay technological innovation. Such effects may, in turn, influence national energy efficiency and the adoption of green technologies. Consequently, tariffs are included in this study as a potential influencing factor to examine their possible impact on GTFEE.
By selecting these variables, this study seeks to comprehensively examine the impact of various factors on GTFEE and provide policymakers with relevant recommendations for effective policy formulation. These data are also sourced from the World Bank database.
Second, drawing from prior literature, this paper selects the following variables to examine their potential impact on GTFEE: (1) technological innovation, (2) communication infrastructure, (3) energy intensity (primary energy), (4) energy structure, (5) foreign direct investment (FDI), (6) level of economic development, (7) industrial structure, (8) the level of fiscal revenues; and (9) the degree of tariff stringency, and (10) the degree of urbanization.
Table 1. Description and data sources of input and output variables.
| Item | Indicator | Unit | Data sources |
SBM | Input | Labor force, total | Thousands | WORLD BANK |
Gross fixed capital formation | Current US$ | WORLD BANK |
Total final energy consumption | PJ | IEA |
Desired output | GDP | Current US$ | WORLD BANK |
Undesired output | CO2 | Mt | WORLD BANK |
Influencing factors | Tech | Resident Patent Applications | Case | WORLD BANK |
Tele | Mobile cellular subscriptions | Subscriptions/ per 100 people | WORLD BANK |
EI (primary energy consumption) | - | Megajoule/ 2017 PPP $ GDP | WORLD BANK |
ES | Alternative and nuclear energy (percentage of total energy use) | % | WORLD BANK |
FDI | Net inflows of foreign direct investment (% of GDP) | % | WORLD BANK |
GNI | Gross National Income (GNI) per capita as measured by the Atlas method | Current US$ | WORLD BANK |
IS | Employment in services (% of total employment) | % | WORLD BANK |
Tax | Taxes (% of GDP) | % | WORLD BANK |
Urban | Urban population (% of total population) | % | WORLD BANK |
| Tariffs | Tariffs and other import duties (% of tax revenues) | % | WORLD BANK |
2.2. Super-efficiency SBM-DEA Model
The Slacks-Based Measure (SBM) model is an enhanced version of Data Envelopment Analysis (DEA) proposed by Tone in 2001 to evaluate the efficiency of Decision-Making Units (DMUs) in terms of resource allocation and output
. Unlike the traditional CCR (Charnes–Cooper–Rhodes) and BCC (Banker-Charnes-Cooper) models, the SBM model directly incorporates input redundancy and output deficiencies (known as slack variables), providing a more comprehensive measure of DMU efficiency. Building on previous studies
| [26] | Huang, T., Zhao, X., Ai, C.-H., Chen, S., Wang, Y., Hu, X. Evaluation of the sustainable development level of countries along the Belt and Road and its impact factors: Empirical analysis based on the Super-efficiency slacks-based measure and Tobit measure models. Chinese Journal of Population, Resources and Environment. 2021, 19, 162–70. https://doi.org/10.1016/j.cjpre.2021.12.018 |
| [27] | Shu, T., Liao, X., Yang, S., Yu, T. Towards sustainability: Evaluating energy efficiency with a super-efficiency SBM-DEA model across 168 economies. Applied Energy. 2024, 376, 124254. https://doi.org/10.1016/j.apenergy.2024.124254 |
[26, 27]
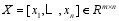
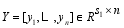
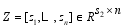
, the super-efficient SBM-DEA model employed in this study is constructed as follows: each DMU, among n DMUs, consists of three components: inputs, desired outputs, and undesired outputs. These components are represented by three vectors: x∈R
m,y∈R
s1,and z∈R
s2, respectively. The following matrix is then constructed:
 (1)
(1)  (2)
(2)  (3)
(3) Here, it is assumed that X > 0, Y > 0 and Z>0. In this study, the production possibility set (P) is defined as follows:
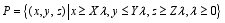 (4)
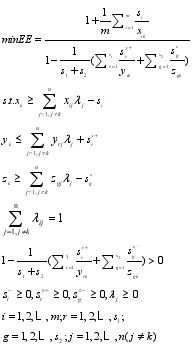
(4) Where λ denotes the intensity vector. The three inequalities in the production possibility set P indicate that when the actual input levels exceed the frontier input levels, the actual non-desired output is higher than the frontier non-desired output, while the actual desired output is lower than the frontier desired output. In this context, the SBM-DEA model, which incorporates non-desired outputs, is formulated as follows:
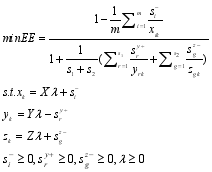 (5)
(5) Where vector

represents the slack in the input variables,

represents the slack in the desired outputs, and

represents the slack in the undesirable outputs. The objective function value, denoted as
minEE, represents the efficiency value of each DMU. Here, m is the number of input factors, and s
1 and s
2 represent the desired and undesired outputs, respectively. If
minEE≤1, the DMU is considered inefficient, indicating that improvements are needed in both inputs and outputs. In the super-efficient SBM-DEA model, the production possibility set is adjusted by excluding a specific DMU (x
0, y
0, z
0). And at this point, the formula for the super-efficient SBM-DEA model is as follows:
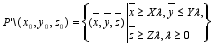 (6)
(6)  (7)
(7) The GTFEE value required in this study is derived from the
minEE calculated according to Equation (
7). When
minEE≥1, it indicates that the DMU is efficient. The variables

,

, and

represent the improvements in input elements, desired outputs, and non-desired outputs relative to the frontier, respectively. Additionally, the model with

returns to scale (VRS). Overall, the super-efficient SBM-DEA model, which includes non-desired outputs, effectively addresses the ranking problem that arises when multiple DMUs are classified as efficient simultaneously, thereby enabling a more precise comparison of the efficiency levels of different decision-making units.
3. Results
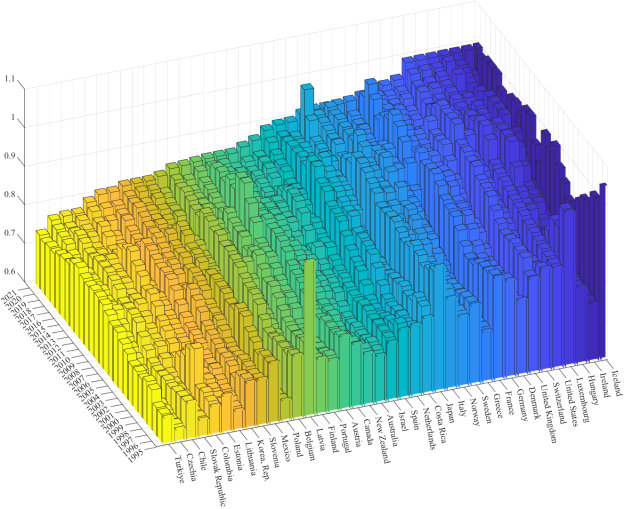
In this section, the paper measures the GTFEE of OECD countries from 1995 to 2021 using the super-efficiency SBM-DEA model and analyzes the performance and development trends of GTFEE across different countries and regions. The GTFEE of OECD countries is presented in
Figure 1.
Figure 1 presents the Green Total Factor Energy Efficiency (GTFEE) of OECD countries, while their geographic locations are shown in Appendix-
Figure 1. As shown in
Figure 1, OECD member countries exhibit both regularities and differences in the improvement of energy efficiency. These changes reflect the combined effects of national energy policies, economic structures, and technological advancements, while also being influenced by external economic and social factors.
3.1. Analysis of Overall Trends
Overall, the GTFEE of the OECD shows a clear upward trend from 1995 to 2021. In 1995, the GTFEE was only 0.7814, but it increased to 0.8894 by 2021. This improvement can be primarily attributed to the widespread adoption of green development strategies by OECD countries, including the integration of renewable energy sources, the implementation of energy efficiency standards, and the acceleration of technological innovation. These measures have greatly significantly expedited the energy transition process.
3.2. Characterization of Changes in Different Countries
GTFEE trends vary considerably from country to country. Individual countries exhibit significant variability in their GTFEE trends. For example, Germany and France have maintained high GTFEE levels for an extended period, with steady growth since 2000, reflecting their ongoing commitment to green energy policies and technological applications. The United States, starting from a lower base, has experienced rapid growth in GTFEE since 1995, likely driven by robust support for green technology research and development, as well as the implementation of stringent energy efficiency policies. In contrast, Nordic countries such as Finland and Sweden have experienced relatively stable GTFEE levels throughout the observation period, due to their early achievement of high energy efficiency, indicating limited room for further improvement.
These trends are influenced by a combination of policy, economic structure, technological progress, and external shocks. Policy-driven factors play a central role in improving GTFEE. OECD countries, in general, have considerably significantly enhanced their energy efficiency through measures such as promoting renewable energy, setting carbon emission targets, and enforcing energy efficiency standards. Additionally, the economic structure of each country affects its energy efficiency. Countries with a high proportion of service industries (e.g., France and Switzerland) tend to be more energy efficient, whereas nations with a strong focus on manufacturing and resource-intensive industries often start with a lower base but have greater potential for improvement.
Figure 1. The GTFEE in OECD countries (1995-2021).
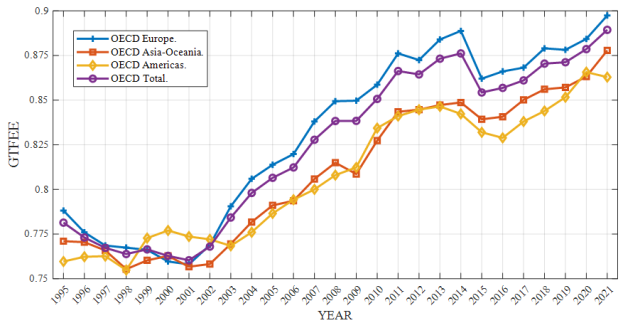
3.3. Characterization of Changes in Different Regions
According to the GTFEE data presented in
Figure 2, the trends across different regions exhibit the following characteristics:
First, in terms of the overall trend, the GTFEE in the OECD region has shown a steady upward trajectory throughout the observed period, suggesting that developed countries have made significant progress in enhancing energy-use efficiency and advancing green technologies. This progress is attributed to technological innovation, transformations in energy mixes (e.g., an increased share of renewable energy), and the implementation of more stringent environmental policies and regulations.
Second, there are notable performance differences across regions. As shown in the figure, the GTFEE level in OECD Europe consistently leads other regions and exhibits relatively little fluctuation. This indicates that European countries have maintained strong consistency and foresight in their green development policies, such as the carbon emissions trading system (ETS) and renewable energy targets promoted by the EU, which have played a positive role in driving energy efficiency improvements.
In contrast, the OECD Asia-Pacific and Americas regions have seen larger increases in GTFEE, although their initial levels were lower. This trend may reflect the fact that countries in Asia-Pacific and the Americas began their green energy transitions later, but have gradually caught up in terms of green energy efficiency in recent years, aided by the introduction of advanced technologies and supportive policy guidance. For example, Japan and the Republic of Korea have substantially improved national GTFEE by implementing the Feed-in Tariff (FIT) policy and maintaining sustained investments in renewable energy and energy-efficient technologies. These efforts have facilitated the optimization of energy structures and the enhancement of technological efficiency, thereby driving advancements in GTFEE
| [28] | Chen, W.-M., Kim, H., Yamaguchi, H. Renewable energy in eastern Asia: Renewable energy policy review and comparative SWOT analysis for promoting renewable energy in Japan, South Korea, and Taiwan. Energy Policy. 2014, 74, 319–29. https://doi.org/10.1016/j.enpol.2014.08.019 |
[28]
.
For instance, countries such as Japan and the Republic of Korea have continually increased their investments in renewable energy and energy efficiency technologies, contributing significantly to the improvement of GTFEE in these regions.
Additionally, while GTFEE in the Americas mirrors that of the Asia-Pacific region, it exhibits more pronounced fluctuations. This volatility may stem from the uncertainty surrounding national energy policies in the Americas. For instance, U.S. energy policy varies significantly between administrations, particularly concerning renewable energy development and fossil fuel use
| [29] | Byrne, J., Hughes, K., Rickerson, W., Kurdgelashvili, L. American policy conflict in the greenhouse: Divergent trends in federal, regional, state, and local green energy and climate change policy. Energy Policy. 2007, 35, 4555–73. https://doi.org/10.1016/j.enpol.2007.02.028 |
[29]
. Moreover, the heavy reliance on resource-intensive industries in some countries, such as Canada and Mexico, may also limit potential efficiency gains
.
Ultimately, the GTFEE curve for the OECD as a whole demonstrates a steady upward trajectory, reflecting the combined performance of the three regions. This suggests that despite varying rates of policy implementation and technological development, the OECD as a whole has made consistent progress in advancing green energy and improving energy efficiency, largely driven by international cooperation and technology sharing. Moving forward, harmonizing policies and fostering technology exchange across regions will be essential for further enhancing global green energy efficiency.
Figure 2. The GTFEE in OECD regions (1995-2021).
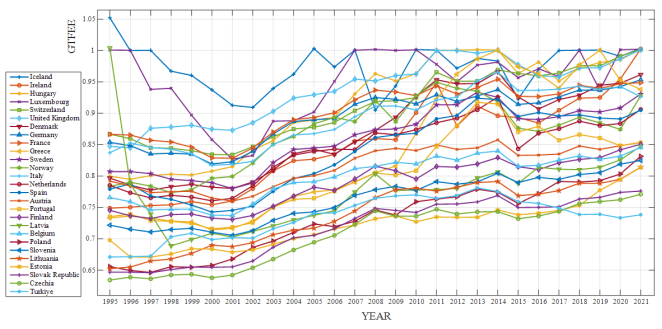
3.3.1. Characterization of Changes in OECD Europe. Region
Figure 3 illustrates the GTFEE trends for countries in the European region. Overall, the GTFEE of European countries shows a steady upward trajectory throughout the study period, indicating ongoing progress in green energy transitions, energy efficiency improvements, emission reductions, and technological innovation. This trend is closely tied to various EU-wide environmental and energy policies, such as the European Green Deal, which urges member states to achieve carbon neutrality by 2050; Renewable Energy Targets, including the expansion of clean energy sources like wind and solar; and the Energy Efficiency Directive, which mandates measures to reduce energy waste.
Despite this overall positive trend, significant differences in GTFEE performance can be observed across Europe:
(1) Efficient countries: Nordic countries such as Iceland, Sweden and Denmark have consistently ranked among the top in GTFEE, demonstrating a steady upward trend. Contributing factors include: 1) Leading energy policies: These countries have generally implemented strict carbon tax policies and strongly promoted the use of renewable energy. 2) Abundant renewable energy resources: Norway’s hydroelectric power and Denmark’s advanced wind power technology are world-leading. 3) Greening of the industrial structure: The Nordic economies are more service-oriented, with a smaller proportion of traditional, high-pollution industries. In the context of the super-efficient SBM-DEA model, Iceland’s GTFEE score of 1.05 signifies that it operates beyond the efficiency frontier, indicating a state of super-efficiency. This result highlights Iceland’s exceptional performance in energy utilization and environmental sustainability, which may stem from advanced technological capabilities, efficient resource allocation, or the successful implementation of green policies.
(2) Midstream countries: Countries like Germany, Italy, have higher GTFEE levels compared to most other European nations, although their growth rate is slower than that of the Nordic countries. This may reflect the complexity of their energy transitions. For instance, Germany is phasing out nuclear energy while accelerating the development of renewable energy as part of its energy transition, but high costs and policy coordination challenges have slowed the pace of efficiency improvements. Additionally, Germany’s higher proportion of manufacturing in its economy presents additional challenges in improving energy efficiency.
(3) Low-efficiency countries: Central and Eastern European countries such as Poland, the Czech Republic, and Slovakia have relatively low GTFEE levels and are experiencing slower growth. Several factors may explain this trend: 1) Dependence on coal: For instance, Poland’s long-standing reliance on coal as its primary energy source has hindered progress in improving green energy efficiency. 2) Stage of economic development: The overall economic development in Central and Eastern European (CEE) countries lags behind that of Western Europe, resulting in insufficient financial and technical support for the green transformation. 3) Insufficient policy implementation capacity: Some countries face resistance or uncertainty when it comes to implementing environmental policies, which slows down their green energy transition.
In the early stage (1995-2005), the GTFEE of some countries exhibited noticeable declines or fluctuations. This could be attributed to several factors, including technological bottlenecks during the early stages of energy restructuring, reduced efficiency resulting from continued reliance on coal and fossil fuels, imbalances in environmental policies, and the diffusion of green technologies. Starting in 2005, GTFEE began to rise steadily in most countries, and the gap between countries gradually narrowed. This suggests a gradual convergence in the pace of the green energy transition among EU member states, driven by the advancement of EU integration and the implementation of common policy frameworks.
Figure 3. The GTFEE in OECD Europe. region (1995-2021).
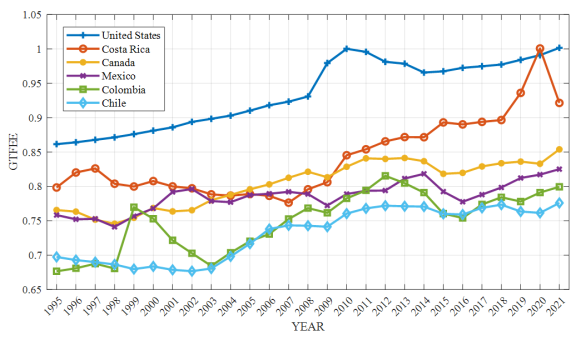
3.3.2. Characterization of Changes in OECD Americas. Region
The GTFEE of Central American countries shown in
Figure 4 generally follows a gradual upward trend over the period studied, indicating progress in energy use efficiency and green development. However, there are marked significant differences in the magnitude of the increase and the level of efficiency among countries, reflecting variations in policies, resource endowments, and technological capabilities.
1) United States
The United States has consistently maintained higher GTFEE levels compared to other countries in the Americas, with steady growth throughout the study period. This is largely due to the country’s strong technological innovation, being a global leader in R&D investment in clean energy and energy efficiency technologies. Although federal environmental policies have fluctuated, states like California have played a crucial role in promoting clean energy and energy conservation. Additionally, the U.S. has a large share of high-tech industries, contributing to more efficient energy utilization.
2) Costa Rica
Costa Rica has also experienced a considerable significant and consistent increase in GTFEE, particularly after 2010, bringing it closer to the U.S. level in recent years. This improvement is mainly due to Costa Rica’s reliance on renewable energy, with over 95% of its electrical energy derived from hydropower, wind, and geothermal sources
. The country’s long-term commitment to sustainable development and its goal to become carbon neutral has also supported its energy transition, leading to a substantial improvement in energy efficiency.
3) Canada
Canada’s GTFEE level has shown steady but small growth, remaining relatively stable at a moderately high level over the long term. This trend can be attributed to Canada’s resource-based economic characteristics, as the country remains highly dependent on fossil fuels such as oil and minerals, which continue to make up a major significant portion of its energy mix. National differences further contribute to the uneven energy efficiency improvements across the country. For instance, Alberta is heavily reliant on fossil fuels, while provinces like Quebec have a higher share of hydroelectricity. Additionally, despite Canada’s commitment to reducing carbon emissions, there are still significant policy constraints, especially the tension between resource development and environmental protection
| [32] | Scott, W. A., Rhodes, E., Hoicka, C. Multi-level climate governance: Examining impacts and interactions between national and sub-national emissions mitigation policy mixes in Canada. Climate Policy. 2023, 23, 1004–18. https://doi.org/10.1080/14693062.2023.2185586 |
[32]
.
4) Mexico
Mexico’s GTFEE has shown a slow upward trend, remaining at a medium level throughout the study period. This is likely due to the slow transition of Mexico’s energy structure, as the country continues to rely heavily on traditional fossil fuels and has not invested sufficiently in renewable energy development. Moreover, despite the existence of environmental policies, the actual implementation is hindered by factors such as economic development levels and policy resource constraints, which affect their effectiveness.
5) Colombia and Chile
The GTFEE levels of Colombia and Chile are close to each other and have increased only modestly. Colombia, being a resource-based economy, is heavily reliant on oil and coal exports, which limits its energy efficiency. However, its abundant hydropower resources partially mitigate these inefficiencies. Chile, on the other hand, has made strides in developing new energy sources, particularly solar and wind power, but its overall GTFEE improvement is constrained by the stage of its economic development and the scope of its policy efforts.
Several countries experienced a brief stagnation or decline in GTFEE around the time of the 2008 financial crisis and again in 2015 when oil prices dropped sharply significantly. This decline can be attributed to factors such as reduced investments in energy infrastructure and lagging policy responses due to the economic downturns caused by these crises.
Figure 4. The GTFEE in OECD Americas. region (1995-2021).
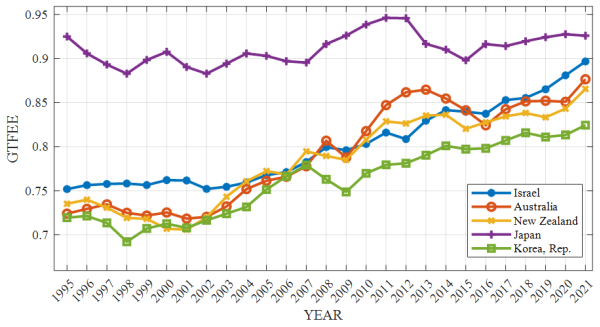
3.3.3. Characterization of Changes in OECD Asia-Oceania Region
Taken as a whole,
Figure 5 illustrates that the GTFEE of Asia-Oceania countries follows a trend similar to that of the Americas, with a general upward trajectory over the study period. Japan stands out with a consistently high GTFEE, maintaining an average value of 0.9114 from 1995 to 2021. This indicates Japan’s sustained efforts in enhancing green energy efficiency, driven by technological advancements and effective policy implementation.
Countries such as Israel, Australia, New Zealand, and South Korea also show consistent year-on-year improvements in GTFEE, though they experienced brief declines around the 2015 crude oil price drop. These fluctuations highlight the substantial significant impact of energy price volatility on green energy efficiency, particularly in countries with high energy dependence. The sharp changes in crude oil prices during this period seem to have disrupted the energy consumption structure and slowed the technological innovation process in these regions, underlining the vulnerability of energy efficiency improvements to global energy price shifts.
Figure 5. The GTFEE in OECD Asia-Oceania region (1995-2021).
3.4. Analysis of Factors Influencing GTFEE
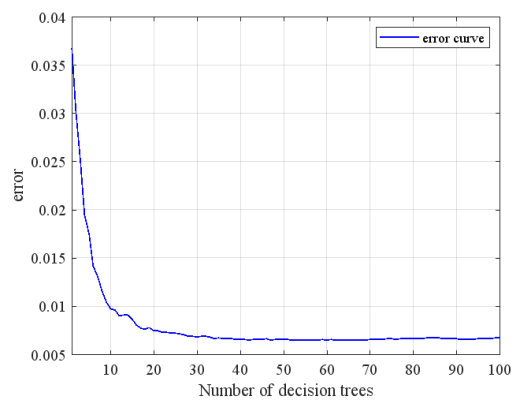
In this section, the study analyzes the effects of various influencing factors on the change in GTFEE using a quantile random forest regression model. The analysis is conducted by dividing the dataset into a training set and a test set, with the training set accounting for 70% of the total data. The data is normalized before performing the regression analysis at the 90% confidence interval level.
Figure 6 illustrates the error curve of the model regression. It is evident from the figure that as the number of decision trees reaches 30, the error curve stabilizes, indicating that the model has successfully converged. This suggests that the quantile random forest regression model exhibits strong stability and reliability, providing a robust framework for analyzing the influencing factors on GTFEE changes.
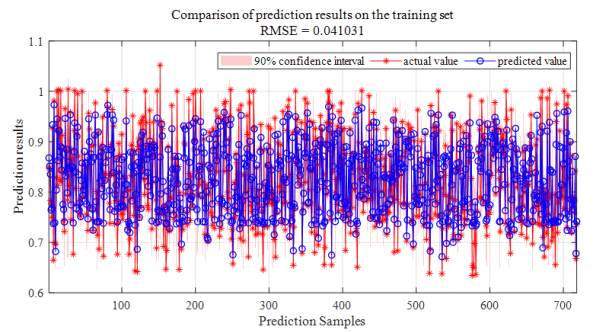
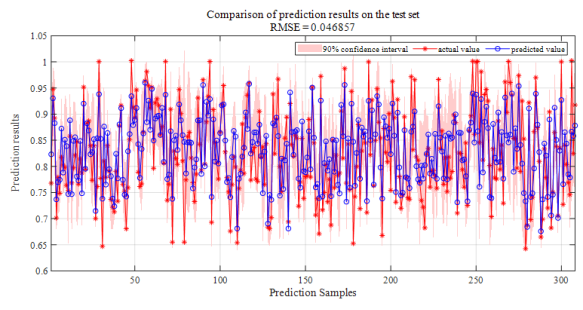
Figure 7 and
Figure 8 show the comparison between the actual and predicted values in the training and test sets, respectively. The root mean square error (RMSE) of the training and test sets are 0.0410 and 0.0469, respectively, which are both lower than 0.05, indicating that the model fits well on the two data sets and has good prediction performance. This result verifies the stability and reliability of the model, indicating that its regression results have high credibility and provide a solid foundation for subsequent analysis.
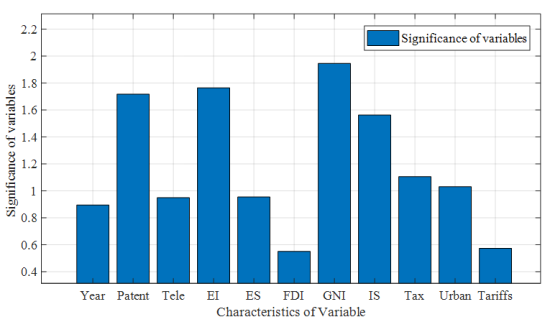
Figure 9 illustrates the impact of various variables on GTFEE and their relative importance. The figure shows that among the variables with a significant impact (significance > 1) on changes in GTFEE, the descending order of importance is as follows: economic development level (measured by GNI per capita), energy intensity (primary energy), technological innovation capacity, industrial structure optimization, the level of fiscal revenues and urbanization. The level of economic development promotes energy efficiency and the adoption of green technologies through industrial upgrading and increased environmental awareness, while energy intensity reflects the efficiency of energy consumption per unit of output, with a reduction in energy intensity directly improving GTFEE. Technological innovation capacity is a core driver, greatly significantly enhancing energy efficiency through the development of cleaner technologies and optimization of energy use. The optimization of industrial structure reduces the share of energy-intensive industries and promotes the growth of the service sector, thus contributing to a large increase in GTFEE. which significantly boosts GTFEE. The scale of fiscal revenues provides crucial financial support for the green energy transition, and moreover, urbanization enhances GTFEE by improving resource allocation efficiency, fostering technological innovation, and optimizing industrial structures. Simultaneously, it strengthens environmental management capabilities, leading to a comprehensive improvement in green total factor energy efficiency.
Figure 7. The Comparison of prediction results on the training set.
Figure 8. The Comparison of prediction results on the test set.
Figure 9. The significance of variables.
4. Conclusion and Policy Recommendations
This paper examines Green Total Factor Energy Efficiency (GTFEE) in OECD countries to address gaps in existing literature on green environmental performance. Using the super-efficient SBM-DEA model, it assesses GTFEE and its trends from 1995 to 2021. The findings reveal significant differences in GTFEE across OECD countries, with Iceland having the highest average value of 0.9740 and an overall average of 0.8245. Key determinants of GTFEE include economic development (GNI per capita), energy intensity, technological innovation capacity, industrial structure optimization, fiscal revenue, and urbanization. Among these, economic development is the most influential, likely improving resource utilization efficiency and promoting technological advancement. Energy intensity, technological innovation, and industrial structure optimization also play important supporting roles in the optimization of energy use.
However, the study has limitations, including the exclusive focus on CO2 emissions as a non-desired output, which may underestimate the impact of other pollutants like SO2, NOx, or solid waste. Future research should incorporate a broader range of environmental data to improve the accuracy of the results. Additionally, factors such as the intensity of policy implementation, inter-regional technology diffusion, and energy price fluctuations, which may influence GTFEE dynamics, were not fully explored. Future studies could address these gaps by incorporating microdata or conducting cross-regional comparisons to better understand the driving mechanisms behind GTFEE and its regional variations.
Against the backdrop of global concern for environmental issues, this paper aims to explore GTFEE in OECD countries to fill the gap in the existing literature and enrich research on green environmental performance. This study employs the super-efficient SBM-DEA model combined with non-expectation to assess the actual GTFEE and its development trend in OECD countries as well as in each region. The main conclusions drawn from this study are as follows: significant differences exist in GTFEE across OECD countries. The GTFEE of OECD countries ranges from 0.6344 to 1.0522, with Iceland having the highest average GTFEE at 0.9740. The average GTFEE of OECD countries for the period 1995-2021 is 0.8245.
The empirical regression results highlight that the main factors influencing GTFEE include the level of economic development (measured by GNI per capita), energy intensity (primary energy consumption), technological innovation capacity, industrial structure optimization, fiscal revenue levels, and tariff levels. This indicates that economic development is the most critical factor in improving GTFEE, likely by increasing resource utilization efficiency and fostering technological advancement. On the other hand, energy intensity, technological innovation, and industrial structure optimization play vital supporting roles in the energy optimization process. While fiscal revenue scale and urbanization are less significant, they still contribute to the overall impact, highlighting the synergistic effects of multidimensional policy interventions in enhancing green energy efficiency.
Finally, this study has some limitations that warrant further exploration in future research. First, due to data constraints, this paper only considers CO2 emissions as a non-desired output in estimating Green Total Factor Energy Efficiency (GTFEE), neglecting other potentially significant non-desired outputs, such as SO2, NOx, or solid waste. This simplification may underestimate the full impact of pollution emissions on green productivity. Future research should develop more comprehensive indicators of undesired outputs by incorporating multidimensional environmental data, which would enhance the scientific accuracy and validity of the results.
Second, due to limitations in data acquisition, this study does not fully explore some important influencing factors, such as the intensity of policy implementation, the effect of inter-regional technology diffusion, and the impact of energy price fluctuations. These factors could play crucial roles in the regional variations and dynamics of GTFEE but were not systematically analyzed here. Future studies could integrate microdata or conduct cross-regional comparative analyses to better understand the driving mechanisms and internal dynamics of GTFEE. This would provide a more complete picture of the factors influencing green energy efficiency.